SmartSurvey has built-in question types for Customer Satisfaction (CSAT), Employee Satisfaction (ESAT), Customer Effort (CES), Employee Effort (EES) and Net Promoter (NPS) surveys.
This guide will explain how to use the EES question Type.
Creating the Question
- Click Add Question on your survey.
- Choose “Employee Effort Score (EES)” from the menu.
- Enter your question text. The “Question” box will be pre-populated with a line of text as a prompt: “How easy was it to…”. Complete this with wording reflecting your requirements. The prompt can be totally overwritten, but as a EES question, you should ensure that the wording of the question is asking about the respondent’s ease or effort needed with the workplace element or situation in question. This can be phrased directly, or as an “Agree - Disagree” statement.
Setting Up The Answer Choices
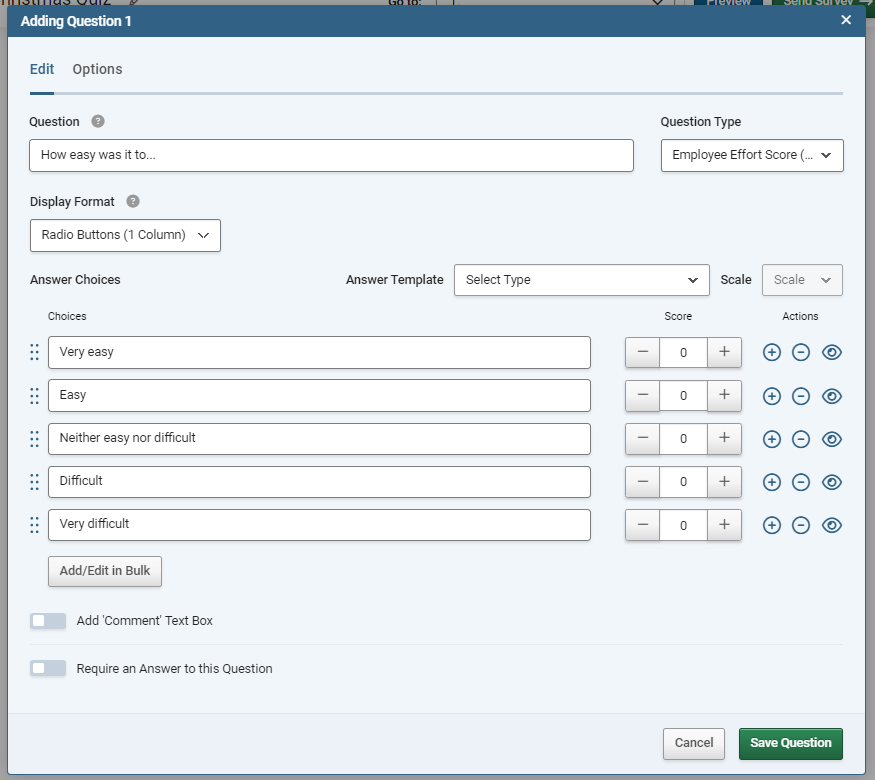
- Choose a display layout for your answer options by using the “Display Format” Drop-Down.
- Choose an answer format from the “Answer Template” Drop-down and choose the scale of points you want to use (5 is the most common). The “Customer Effort Ratings” options will be at the top of this drop-down and we recommend using them.
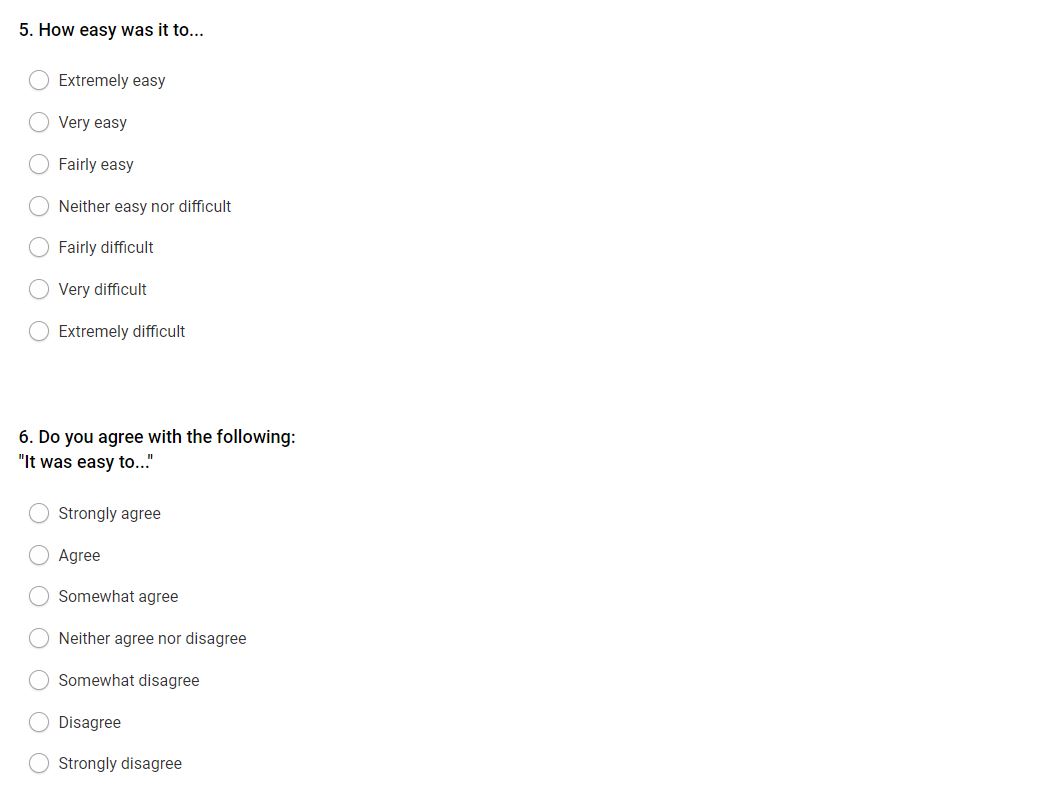
- Easy - Difficult: Text only – 2-point to 7-point scale.
- Agree - Disagree: Text only – 2-point to 7-point scale.
DO NOT CHANGE THE ORDER OF ANSWERS: Answers need to be ordered in ascending order of difficulty to work. . Do not use the drag and drop on the answer order, or otherwise change the order of response options as this will cause scores to be reported incorrectly. (See "Reporting" below for a link to a scoring calculation).
Reporting
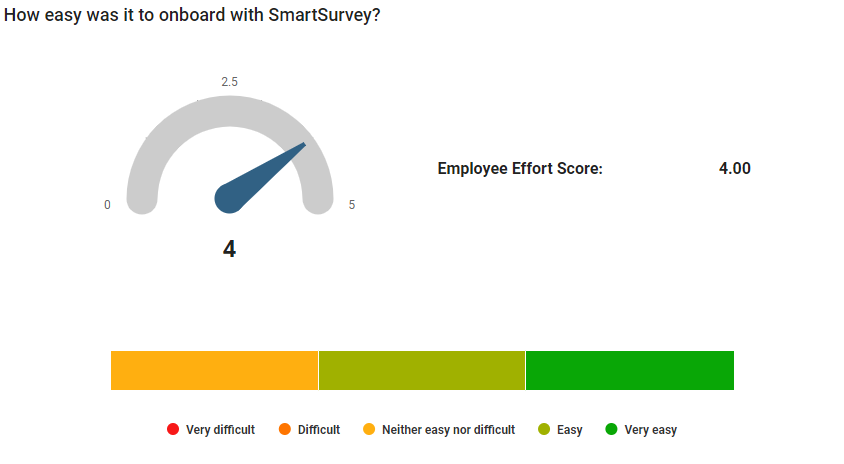
EES questions get access to the "Gauge" chart type for the summary report. This will show the score for the question, placed on a scale from 0 to the number of options used.
In addition to the Gauge visual, EES questions can also be set to the Column, Trend, Bar, Pie, Line, or Area chart types. When put into these modes, the data presented will be the breakdown into Detractors, Passives, and Promoters.
The CES Gauge chart visual has some options that are not available to most questions:
| Gauge |
Set whether or not the Gauge visual is included. |
| Stacked Bar |
Toggle the bar showing the visual breakdown into specific answers on and off. |
| Statistics Table |
Toggle the table of numerical data (to the right of the gauge) on and off. |
Information for all other options, and for the "Display Options" tab, can be found in the guide "Creating charts from Survey Results"
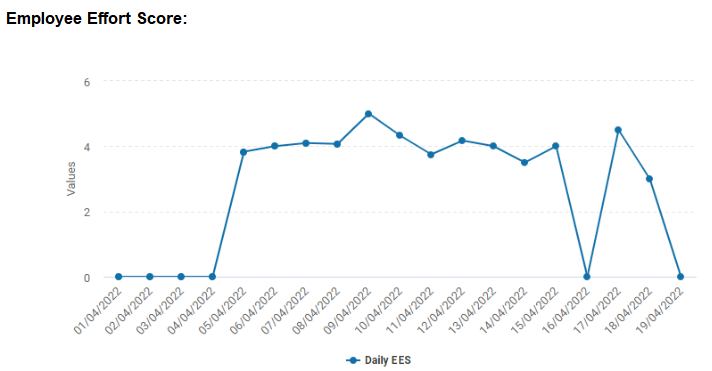
Trend Chart
The Trend Chart shows the calculated Employee Effort Score over time. It does this by dividing the responses into groups based on a time window (Day, Week, Month, Quarter, Year) and then calculating the Effort Score for each group. this is then displayed on the chart.
Trend Chart Options:
| Trend By |
Set the period that each point on the chart will represent. |