SmartSurvey has built-in question types for Customer Satisfaction (CSAT), Customer Effort (CES), and Net Promoter (NPS) surveys.
This guide will explain how to use the CSAT question Type.
Note that we have calculators on our website here that can be used to check that you get the result that you want.
Creating The Question
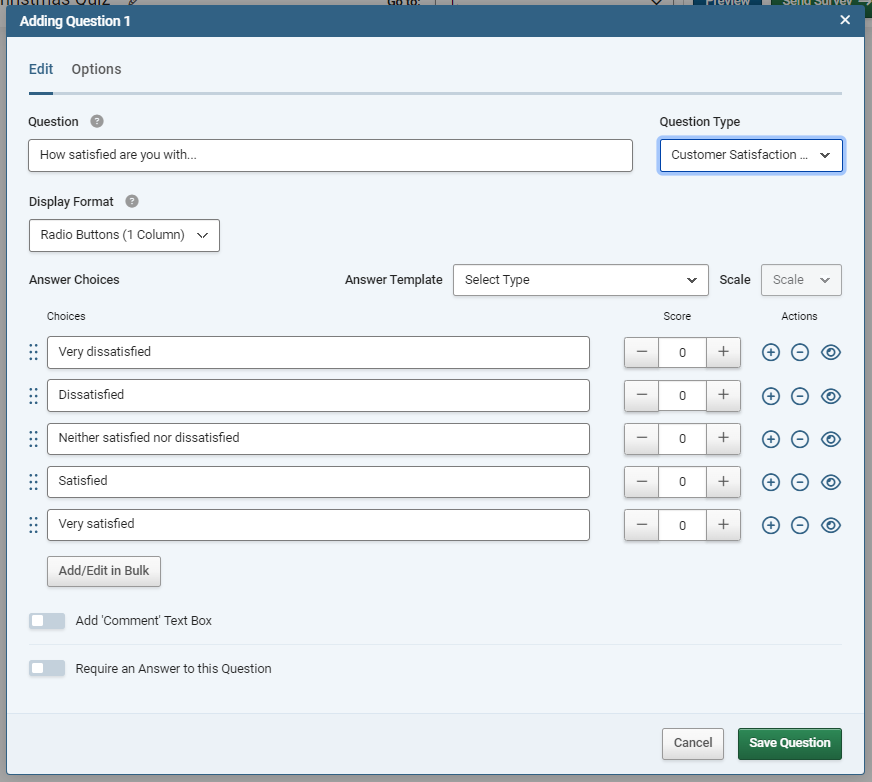
- Click Add Question on your survey.
- Choose “Customer Satisfaction Score (CSAT)” from the menu.
- Enter your question text. The “Question” box will be pre-populated with a line of text as a prompt: “How satisfied are you with…”. Complete this with wording reflecting your requirements. The prompt can be totally overwritten, but as a CSAT question, you should ensure that the wording of the questions is asking about the respondent’s satisfaction with the product, service, or other object of enquiry.
Setting Up The Answer Choices
- Choose a display layout for your answer options by using the “Display Format” Drop-Down.
- Choose an answer format from the “Answer Template” Drop-down and choose the scale of points you want to use (5 is the most common). The “Satisfaction Ratings” options will be at the top of this drop-down and we recommend using them. These are illustrated below (Displayed on Chrome in windows 10):

- Dissatisfied - Satisfied: Text only – 2-point to 7-point scale.
- Dissatisfied – Satisfied (Emojis): Uses standard emojis which should work on any device. Emoji images will vary by device. 2-point to 5-point scale.
- Dissatisfied – Satisfied (Classic Smileys): Uses SmartSurvey smileys which should work on any device. Smiley images will be standardised across devices. 2-point to 5-point scale.
DO NOT CHANGE THE ORDER OF ANSWERS: Answers need to be ordered in ascending order of satisfaction to work. Do not use the drag and drop to reorder the answers, or otherwise change the order of response options as this will cause scores to be reported incorrectly. (See "Reporting" below for a link to a scoring calculation).
Reporting
CSAT questions get access to the "Gauge" chart type for the summary report. This will show the score for the question, placed on a 0-100 scale.
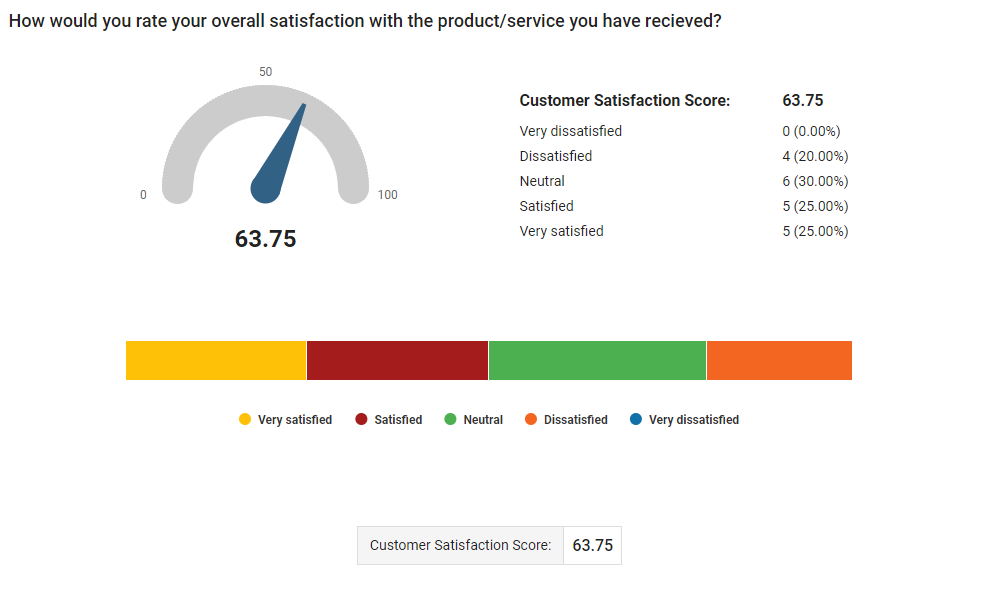
In addition to the Gauge visual, CSAT questions can also be set to the Column, Bar, Pie, Line, or Area chart types.
The CSAT Gauge chart visual has some options that are not available to most questions:
| Gauge |
Set whether or not the Gauge visual is included. |
| Stacked Bar |
Toggle the bar showing the visual breakdown into the specific answers on and off. |
| Statistics Table |
Toggle the table of numerical data (to the right of the gauge) on and off. |
Information for all other options, and for the "Display Options" tab, can be found in the guide "Creating charts from Survey Results"
Trend Chart
The Trend Chart shows the calculated Customer Satisfaction Score over time. It does this by dividing the responses into groups based on a time window (Day, Week, Month, Quarter, Year) and then calculating the CSAT for each group. this is then displayed on the chart.
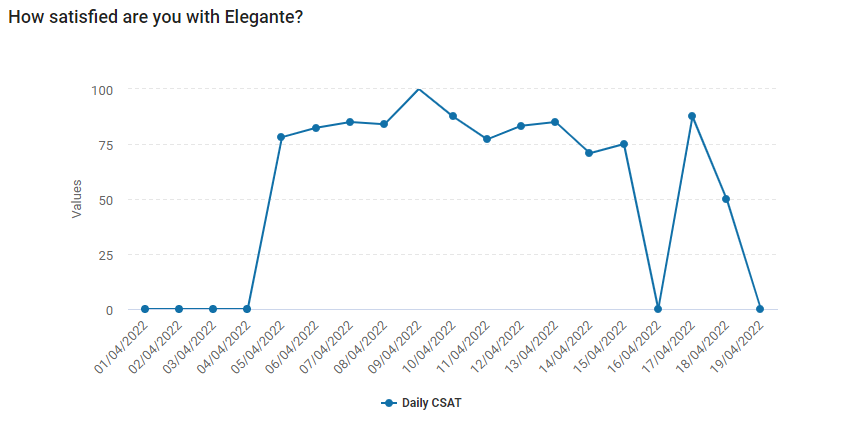
Trend Chart Options:
| Trend By |
Set the period that each point on the chart will represent. |