Back
BackAdding content to your dashboard
Dashboard content comes from two places: tiles you add directly within the dashboard itself, and content you pin from a survey's results summary. This guide covers both.
Adding a tile directly in your dashboard
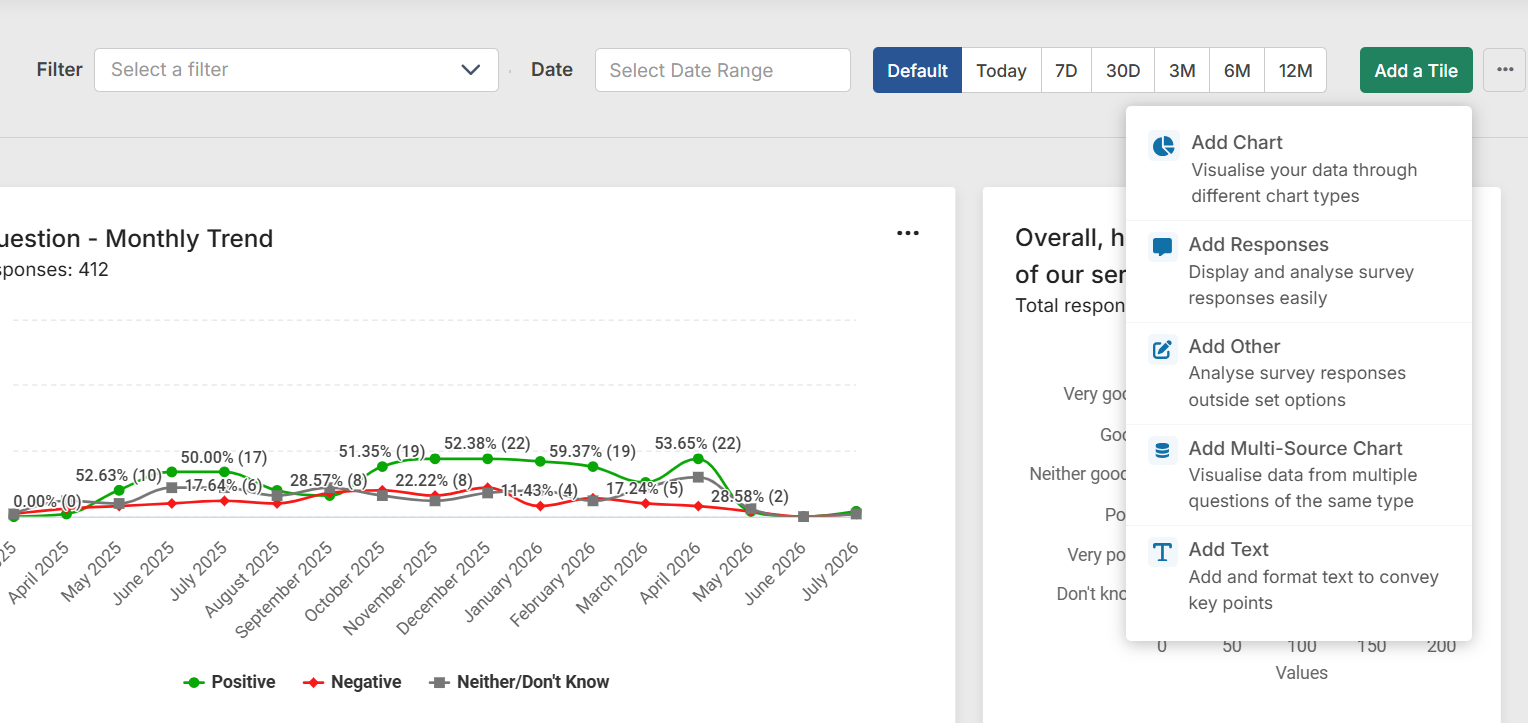
Select Add a tile from within your dashboard. You can choose from five tile types:
- Add Chart
- Add Responses
- Add Other
- Add Multi-Source Chart
- Add Text
Adding a chart
When adding a chart tile, choose whether to visualise question and answer data, or response counts for the whole survey. Reporting on response counts alongside answer data lets you see collection volume and answer breakdowns side by side.
You can also report on response counts by collector (tracking link), which is useful for comparing how different distribution channels are performing.
 |
|

Adding Responses
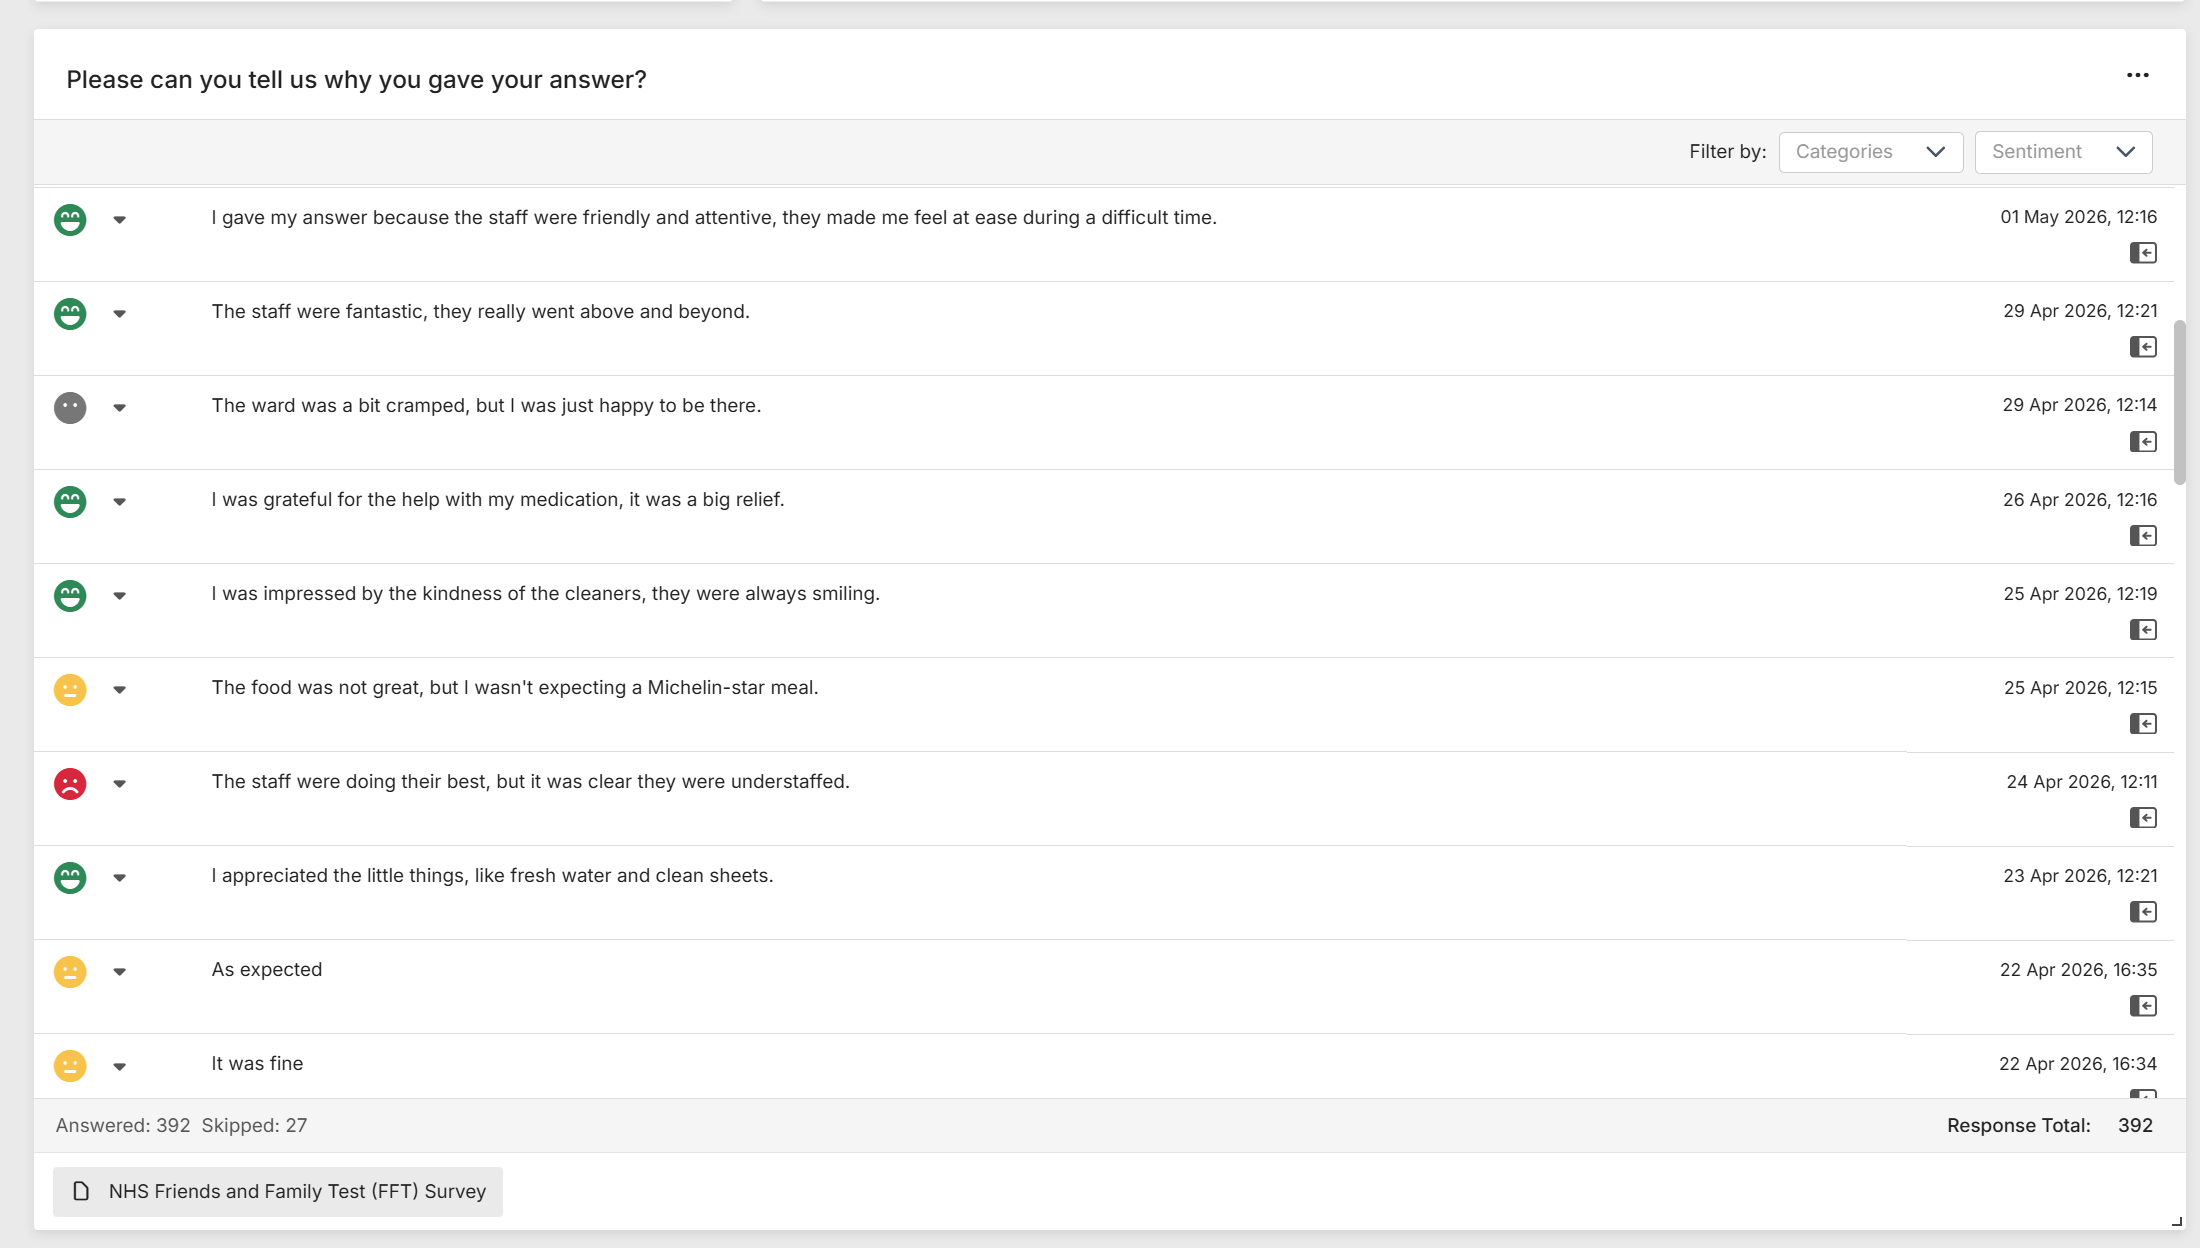
Adding Responses follows a similar step to adding a chart, however the tile will simply show a list of all text responses for the question, including Sentiment Analysis and Text Analysis categories if they are enabled.
Adding a multi-source chart
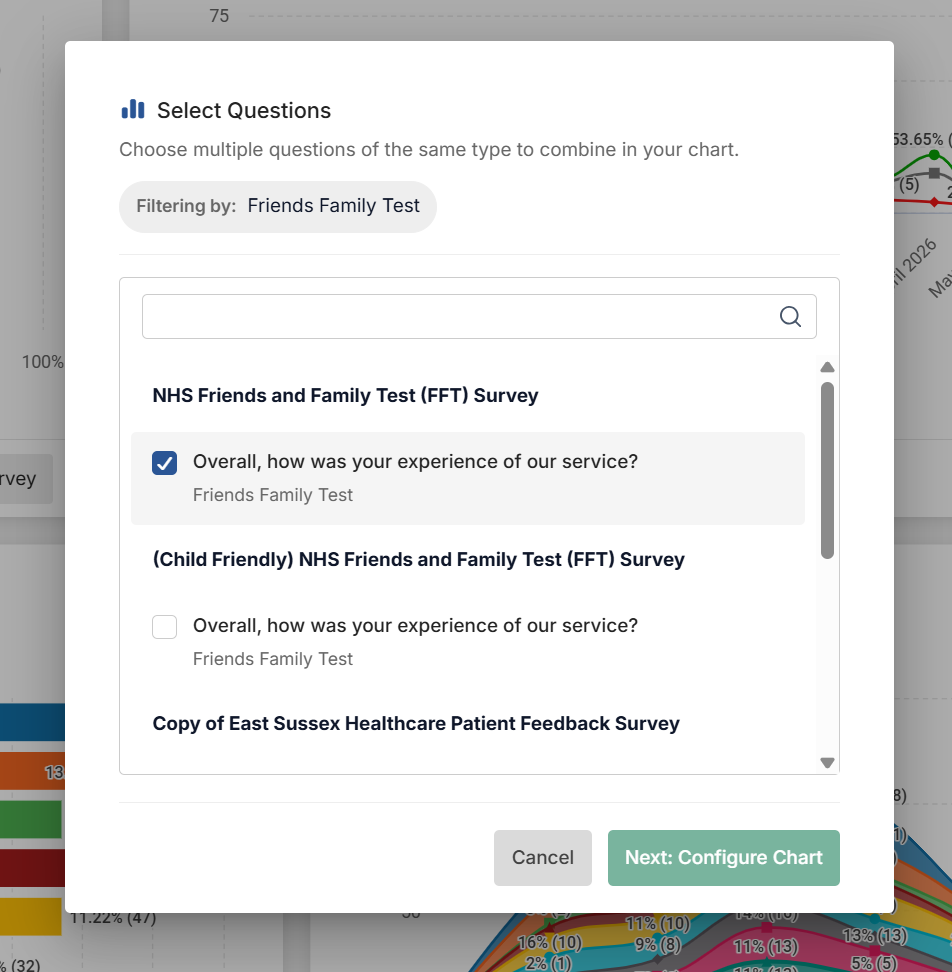
A multi-source chart aggregates responses from multiple questions or surveys into a single chart, based on the answer choices being the same. This is useful for comparing the same question across different surveys or time periods, such as tracking an NPS question that appears in several survey waves.
Multi-source charts are covered in full detail in a dedicated guide, since the setup differs from a standard chart tile.
Pinning content from a results summary
Pinning lets you send a chart or response data straight from a survey's results summary to a dashboard, without rebuilding it from scratch.
You can pin the following content types:
- Charts, along with their associated settings
- Open text responses, including sentiment analysis
What you can and cannot pin
Chart creation is supported for these question types:
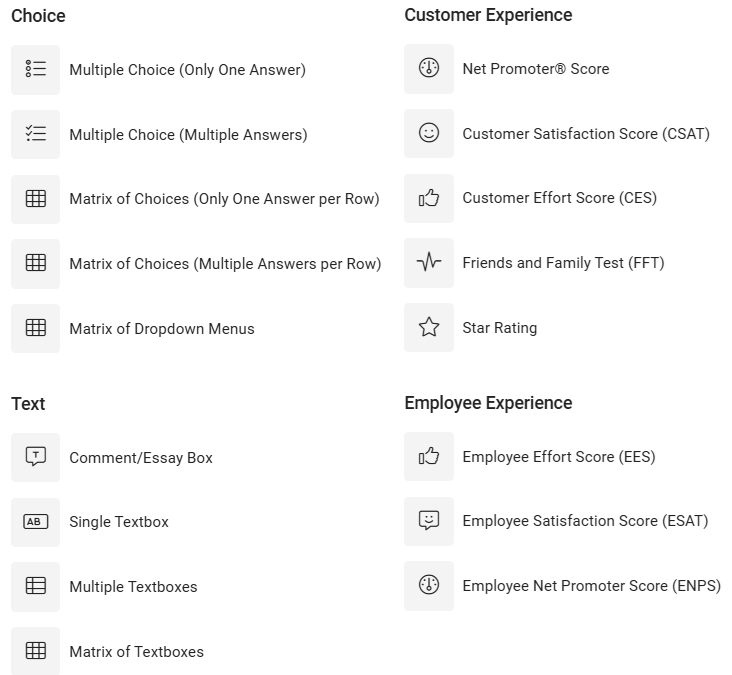
Chart creation is not supported for these question types:
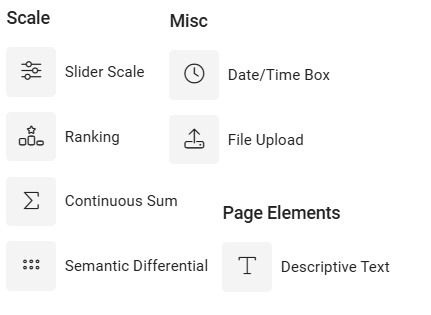
How to pin content
- Go to the results summary for your survey
- Create a chart or configure your view settings as needed
- Save your changes
- Select Pin, then choose an existing dashboard or create a new one
Once pinned, you'll see a success message with the option to view the content on the dashboard.
[NEEDS: screenshot of the pin flow and success message]
How pinned content behaves after pinning
When you pin content to a dashboard, the tile becomes detached from the results summary. This means:
- You can change the results summary later without affecting the dashboard tile
- You can make minor changes to the tile from within the dashboard itself, such as chart type (coming soon)
Viewing responses from a dashboard tile
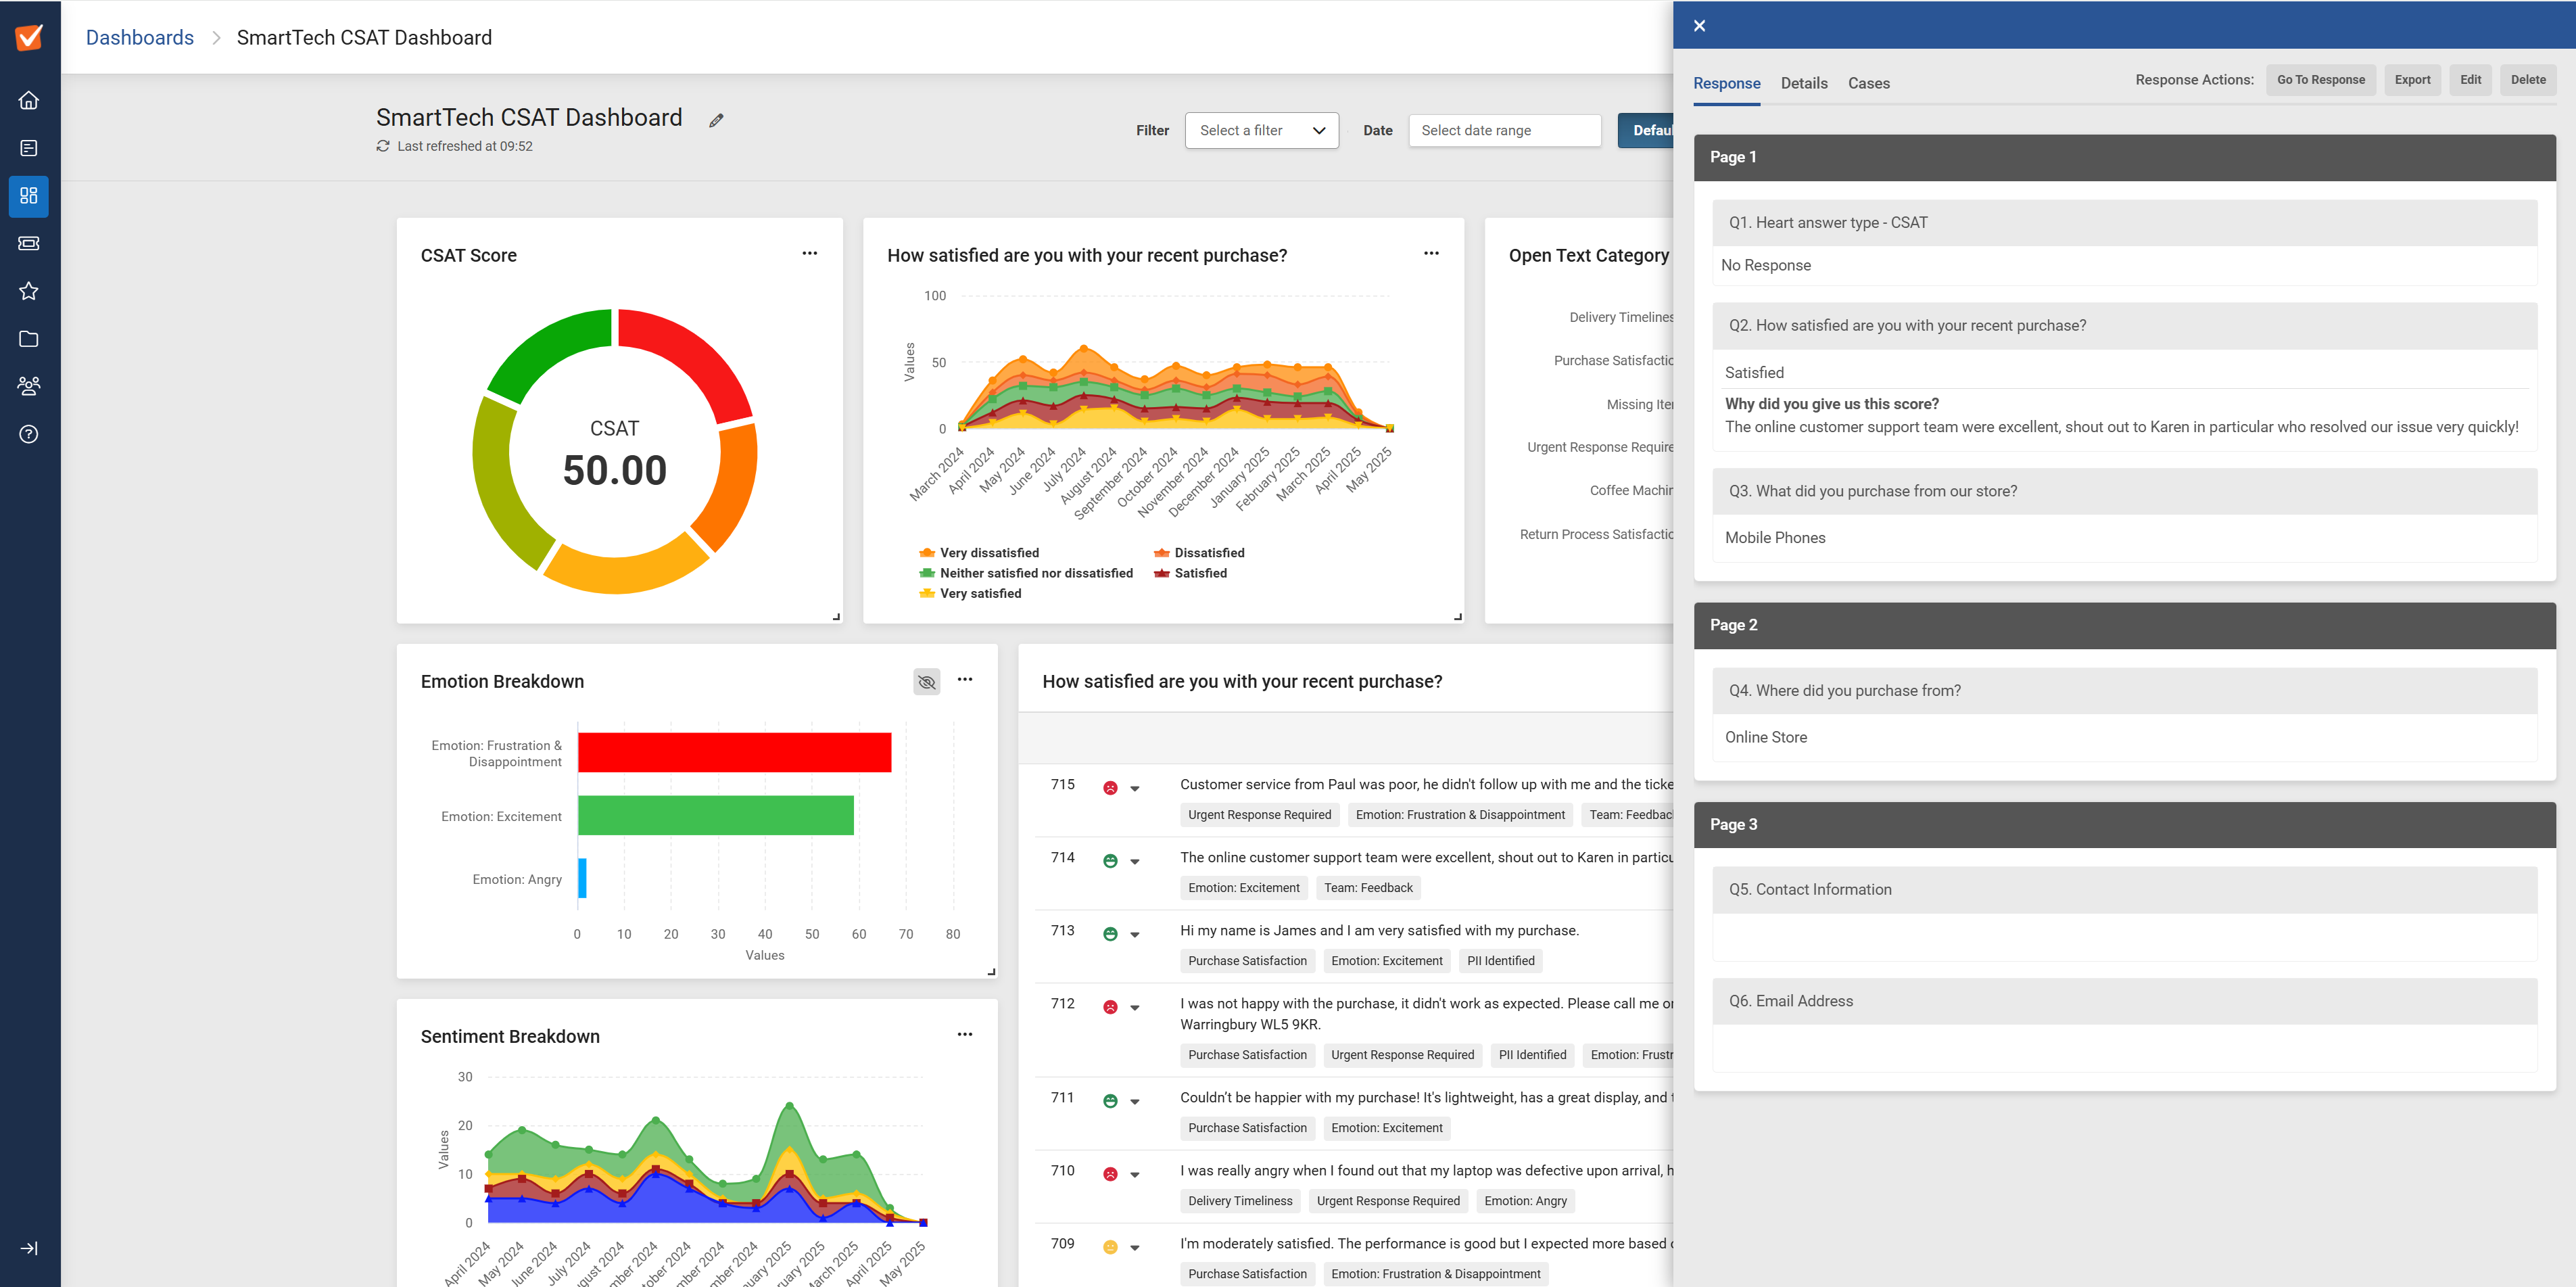
From a Responses tile, select an individual response to open the response sidebar and view it in full.
Depending on your survey permissions, you may also be able to:
- Edit the response
- Delete the response
- Create a case for follow-up