Accessing Text Analysis
To access Text Analysis, select it from the left-hand side menu on the Analyse screen of your survey. This will open the Text Analysis page.
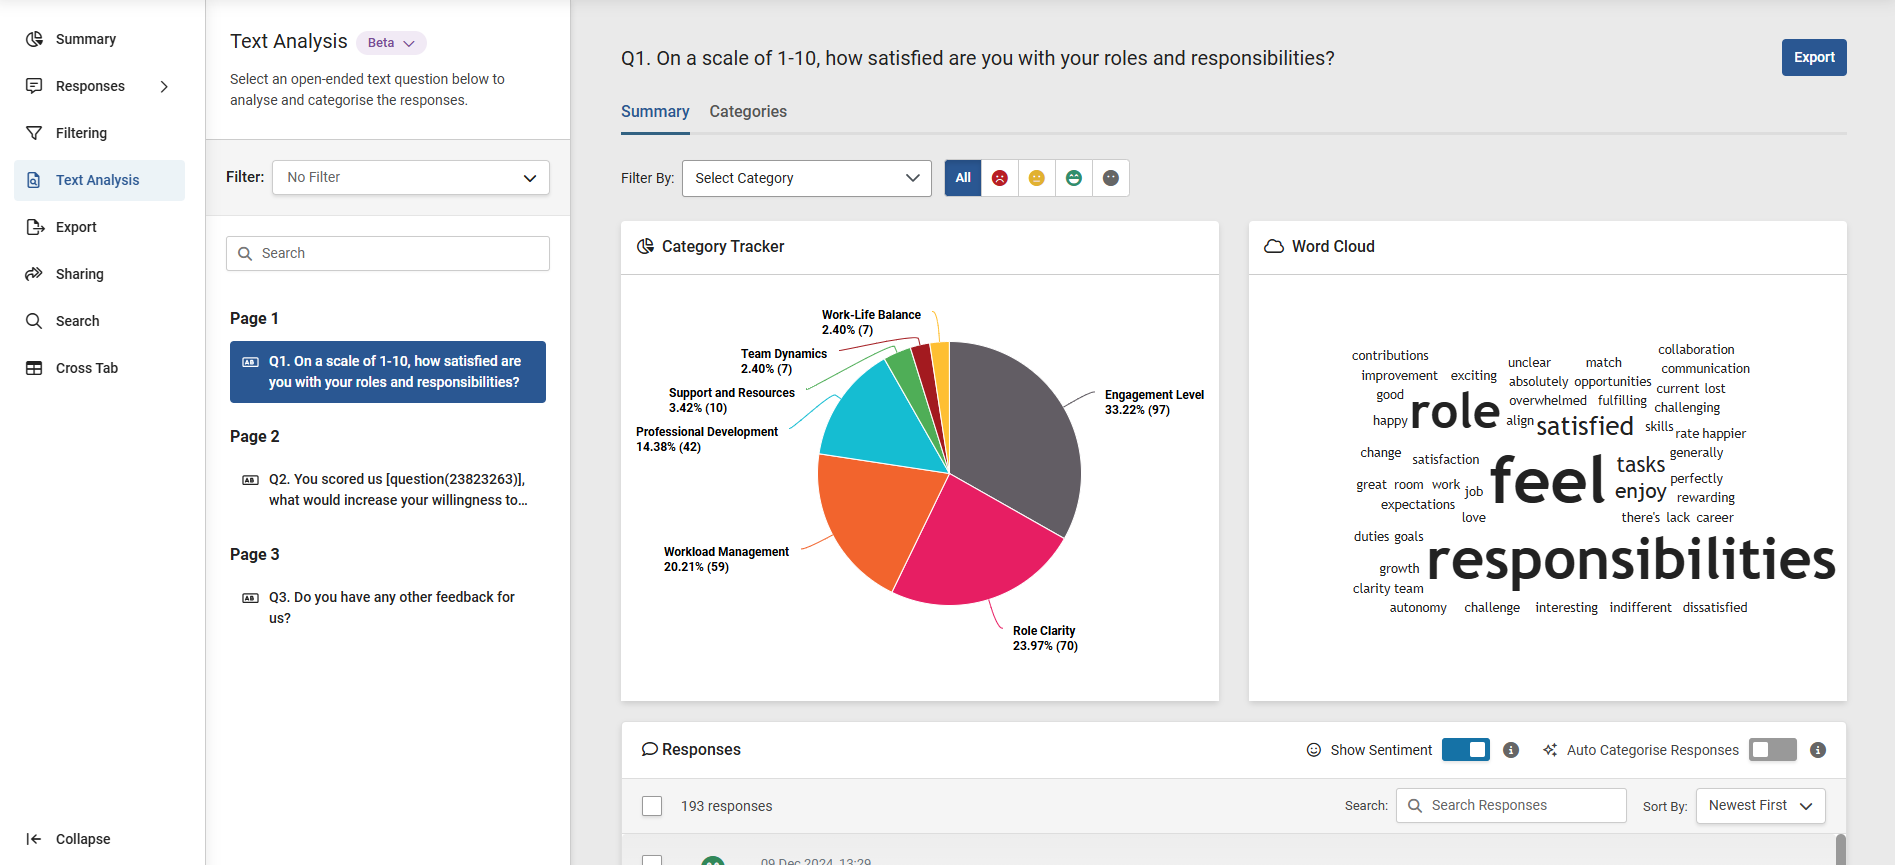
The page consists of these main areas:
Filter and Question List
On the left of the page, you’ll find a bar listing all questions on the survey that are eligible for text analysis – free text questions or multiple choice questions with comment boxes. Above this area is a filter drop-down allowing you to select any of the filters set up for your survey.
To start, choose a question from the question list. By default, the first elegible question will be selected for analysis.
Analysis Area
The Analysis Area has two modes, a summary view and a category viewer. They are selected via the tabs at the top of the page.
Summary:
This consists of the following elements, from top to bottom.
- Category and Sentiment Filters: At the top of the summary area is a filter drop-down. This will filter the other elements on the page based on the applied categories. If Sentiment Analysis is also applied, a set of icons allowing filter by applied sentiment can also be applied.
- Category Chart: On your first opening of the page for any survey, you’ll be prompted to Add Categories, as the breakdown chart won’t have anything to display without them. When categories have been applied to responses, you'll see a pie chart here that shows a % breakdown of categories from the total number of categories assigned to your responses.
- Word Cloud: Alongside the Category Chart is the Word Cloud which gives you an summary of the most frequent words used in responses to the selected question. This makes it easy to quickly identify key themes for more investigation.
- Response List: This is the list of text responses to the selected question. For performance reasons, this is paged, and you can change the size of the pages, and navigate through them using the options below the list. From here you can assign categories to your responses.
Adding Categories:
There are two main ways to create categories to text responses: Via the Category Setup Manager, or ad-hoc. The setup manager makes it easier to create a category list before you start categorising responses. However, if you want to do it in the older ad-hoc way, you can skip over this section and start directly categorising responses from the list as before.
Using Category Setup
Suggested Categories
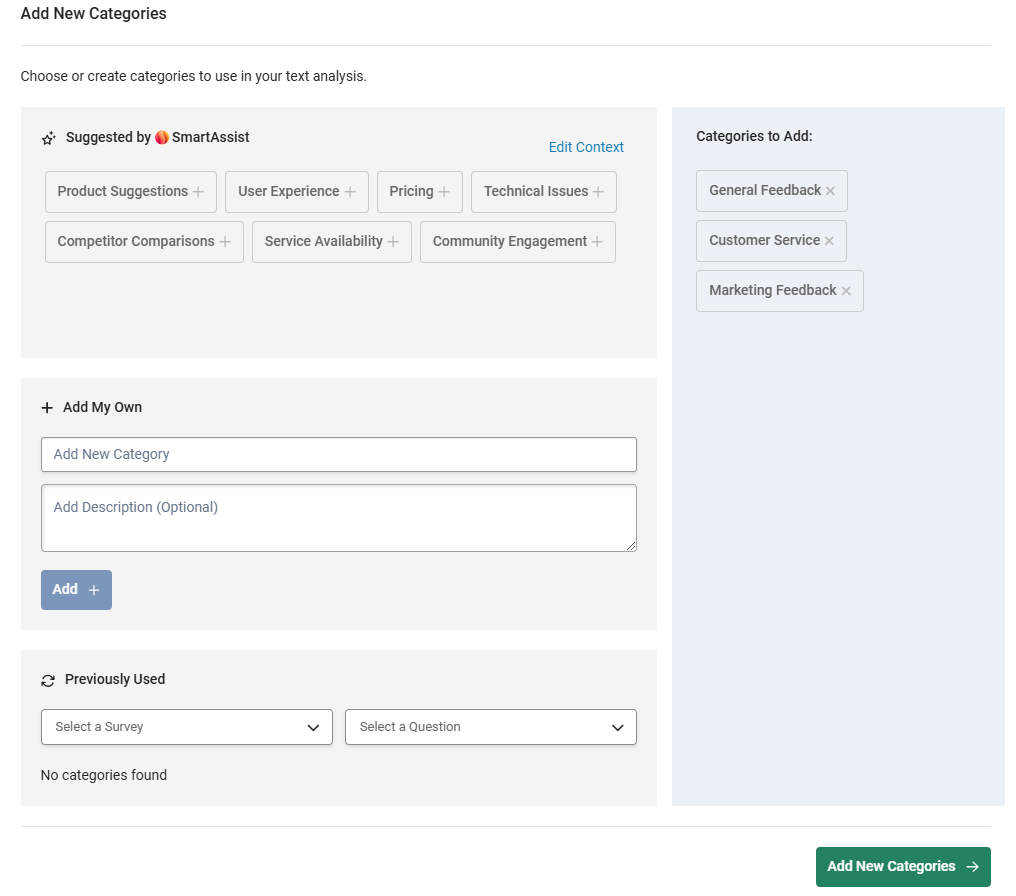
You can use AI to suggest a list of categories for your survey. To do this, click the blue Add Categories button either in the space for the Category visual, or in the table displayed by clicking the Categories tab. You’ll be prompted for a brief description of the survey and this will be used to generate a list of suggested categories. (No response data is used for this, it’s solely based on the prompt.).
This will then load the second stage. This page displays the AI suggestions, an option to add your own New Categories and a Previously Used section where you can choose categories always added on previous survey questions.
Creating the Category List
On the right, is a blue box. This is the categories you’re actually going to use. To start with, it will be blank.
To add categories from the suggested list, simply click on each one and it will be moved into the blue box.
To add any of your own, then use the second box. Add a name for the category, an optional description, and click the Add + button. The category will be added to the blue box.
To re-use a set of categories you’ve used on a previous survey (or a question on the same survey survey), you can use the Previously Used box to select the survey, and the relevant question. This will load up the categories for that question in the same way as the AI suggestions, and then you can add them to the blue box by clicking them the same way.
If you want to remove a category from the list, click it in the blue box. Click Next to proceed.
Finishing Setup
You’ll then be asked about if you want to activate sentiment analysis (depending on plan) and then a reminder screen will show at the end of the process.
If you want to add more categories after going through this process, you can. The AI suggestions will be re-run and new ones will be available to add in the same way. If the AI suggests something that’s already in the list, then these will be shown, but greyed out.
Categorising Responses from the list
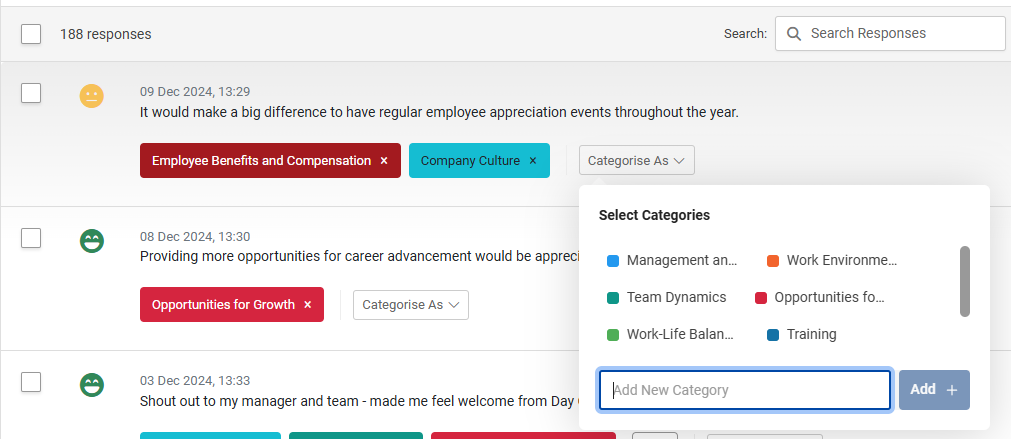
To apply a category to a response, simply click on the Categorise As button under each response. This will open a small pop-up. You’ll see all the previously-created categories as tags, and you simply click on the one you want to apply the category. Below this is a text box to create a new category.
Creating a new Category from the response list.
To create a new category, with the Categorise As pop-up open, enter the text you want to use as the new category tag into the box and click Add. This will create the category and automatically apply a colour to the category. It will also apply the category to the selected response.
Category Viewer
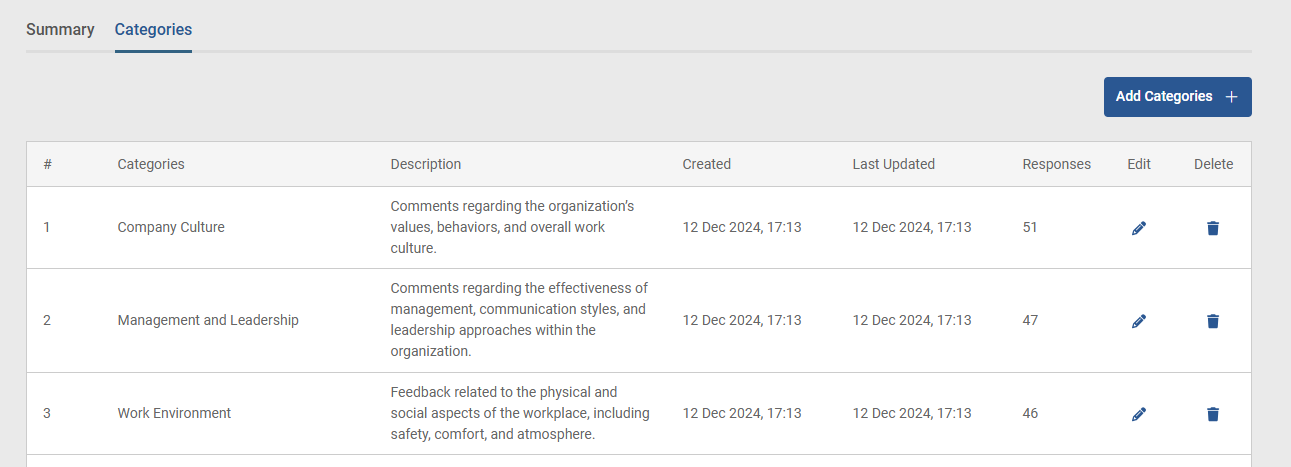
Once a set of categories has been set up, clicking the Categories tab will display a page with a detailed list of the categories applicable to the question being viewed. From here you can edit the names , colours, and descriptions of categories, and see some top-line data about how many responses have each category and when the category was created and updated. You can also delete any categories from here.
Export
Text Analysis data can be exported using the Export button at the top-right of the summary area. This will export the data for the selected question with responses and categories. When exporting, you can choose to have all the applied categories for each response be in a single column, or in separate columns.