Sentiment Analysis automatically tags your open text responses as either Positive, Neutral, Negative or Mixed as they are recieved on your survey.
This helps you to identify feedback or responses that need urgent followup more quickly and in real time, avoiding the need to spend time manually reviewing responses.
So whether you're running customer experience, employee experience, feedback programs or general research projects, you have the flexibility to monitor feedback and prioritise follow up more efficiently.
Determining whether your incoming free-text responses have positive, negative or neutral sentiment can be a time consuming, manual process.
Our automatic Sentiment Analysis feature reviews the response and assigns a recommended sentiment as the response is recieved on the survey, giving your valuable insights in real time.
Sentiment Analysis is available on our ENTERPRISE PLUS Plan.
How is Sentiment determined?
- Positive - The response has a clear positive sentiment
- Negative - The response has a clear negative sentiment
- Neutral - The response is neither positive or negative sentiment, can include
- Mixed - The response has a mix of both positive and negative sentiment
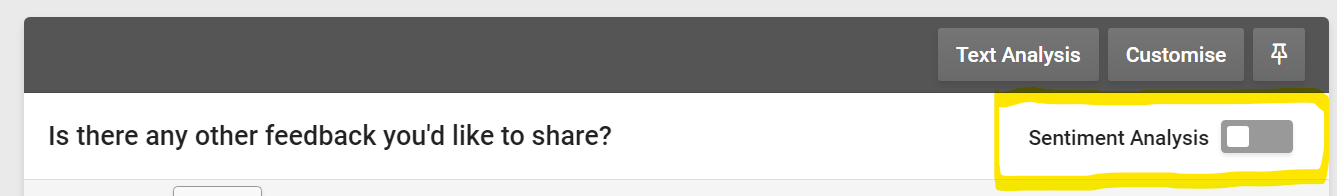
How to enable Sentiment Analysis
You can enable Sentiment Analysis from within your Survey Results summary. The option will currently appear on 3 types of answer:
- Single Textbox
- Comment/Essay Box
- Answers which include "Comments" only.
You'll see an option to toggle "Sentiment Analysis" on.
Whilst the feature is in Beta release, Sentiment Analysis can only be enabled on surveys with under 15,000 responses.
Once enabled you'll see a pulsing thinking icon which indicates that the responses are in the process of updating the Sentiment. This may take a few minutes.
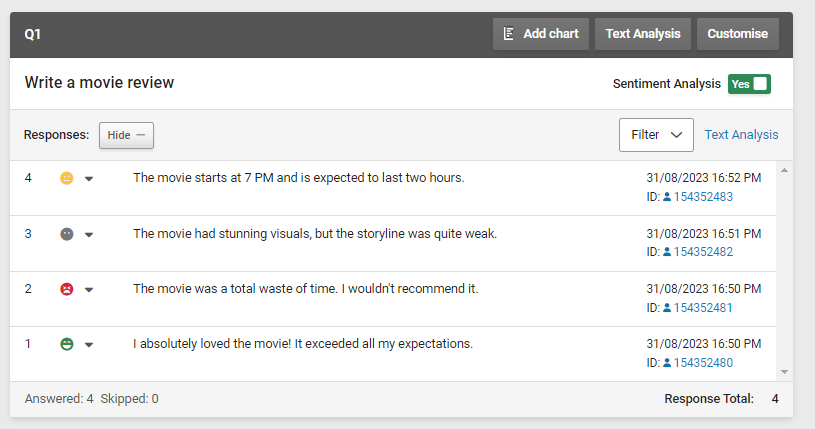
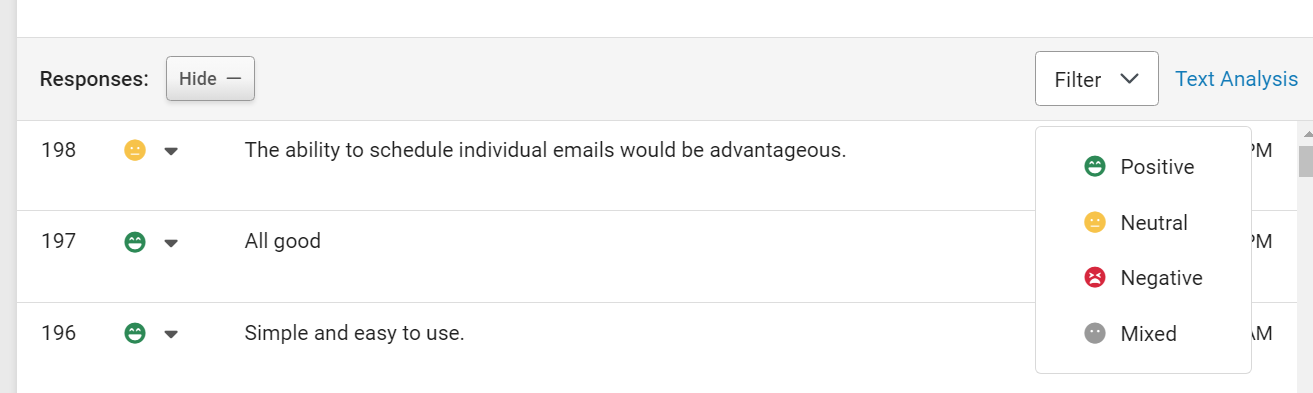
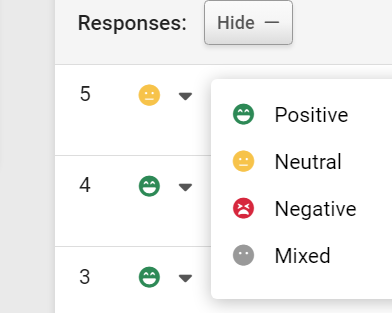
Once the Sentiment for each response has been updated you're able to filter the response list by Sentiment type. This makes it easier to identify different groups; responses that need follow up and responses that may require you to change the suggested sentiment.
Our Sentiment Analysis may suggest a sentiment that you don't agree with based on your human understanding of the context of the response.
You can manually update the Sentiment by clicking on the emoji icon and changing the Sentiment, once changed, it's automatically saved and cannot be reverted.
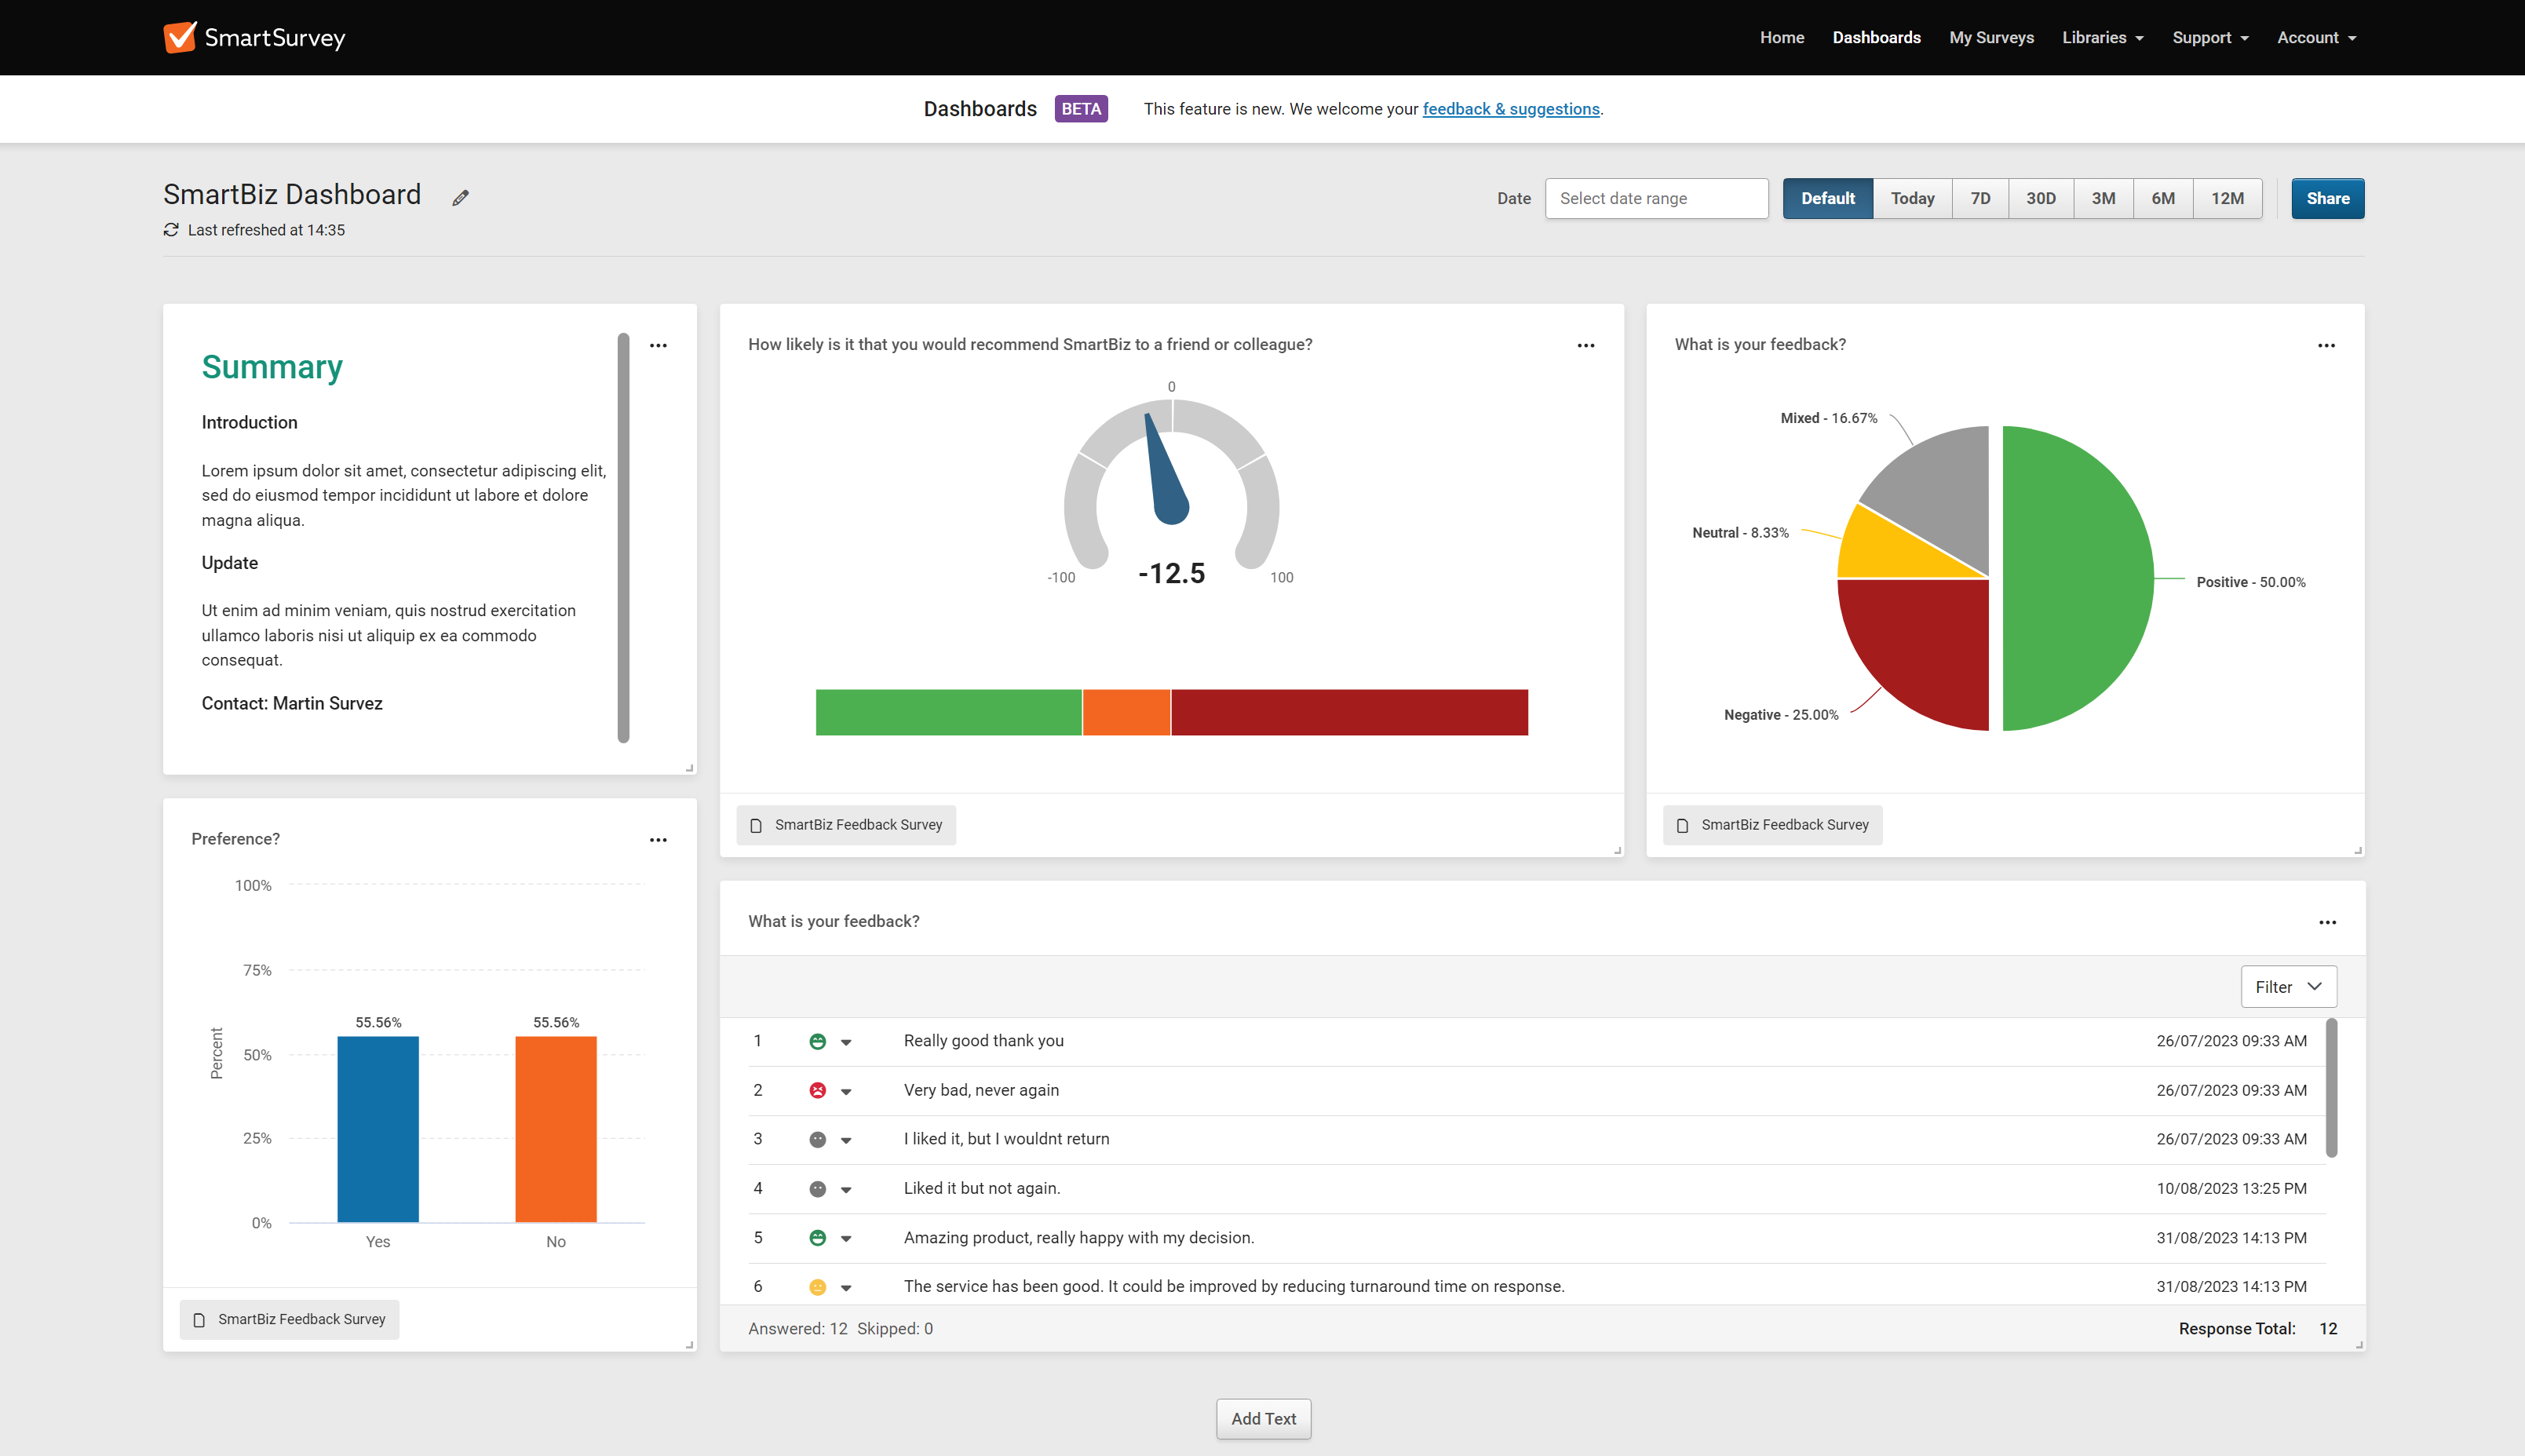
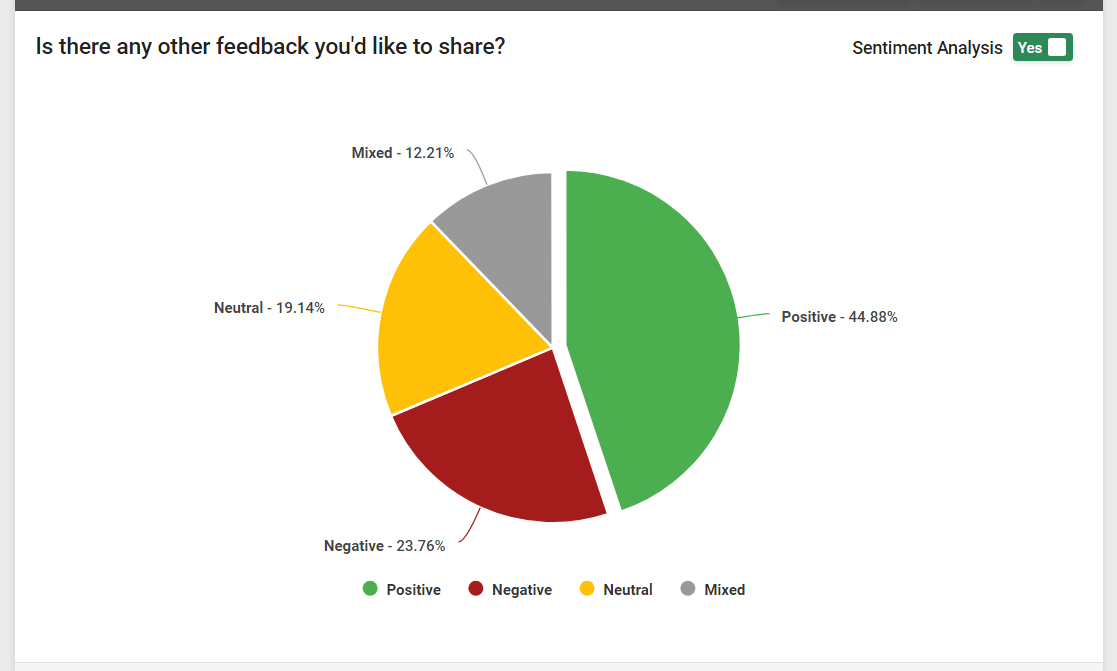
How to visualise and share Sentiment Analysis Data
When Sentiment Analysis is enabled and your data has been generated, you'll be able to visualise the % of responses by Sentiment using different chart types, including:
- Arc
- Column
- Bar
- Pie
- Stacked Bar
- Stacked Area Trend (Coming soon)
- Trend (Coming soon)
You can save the Chart within your Results Summary view so you can refer to it in future, as well as a creating a custom shared view, so you can allow your teams and stakeholders to view the data.
You can pin both the Chart & the Response List to your Dashboards, allowing you to monitor response data across multiple surveys and touchpoints within your customer journey.
In both instances the information will be updated every 5 minutes.