SmartSurvey Dashboards provide you with a central place to analyse your survey data and monitor incoming responses and key metrics from any survey in your account in one place.
So whether you're running customer experience surveys, employee experience surveys, feedback programmes or general research projects, you have the flexibility to visualise your data in the way you want to, to support analysis and decision making.
How to create your dashboard
You can create your dashboard in two ways.
Firstly, go to Dashboards within the blue navigation bar on the left of the page, this page provides you with a list of all Dashboards you've created as well as Dashboards shared with you by other members of your account.

Secondly, you can create a dashboard when you start to Pin content from your results summary. See more in the next paragraph.
How to populate your dashboard with content tiles
Dashboard content originates from two places, either by "pinning" charts and responses from your survey results or you can add dashboard tiles directly within your dashboard.
Pinning Data from the Results Summary
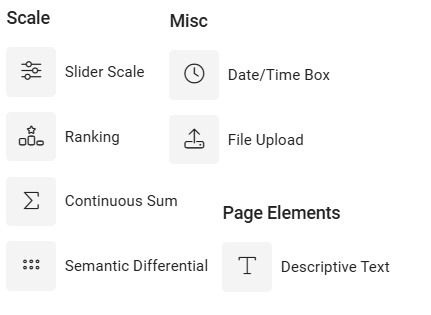
Chart creation is supported for these Questions Types:
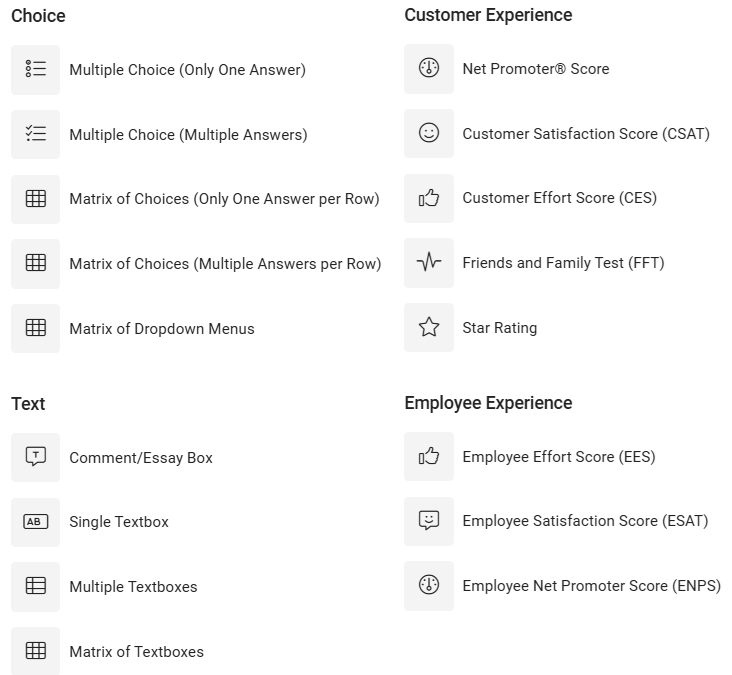
Chart creation is NOT supported for these Questions Types:
You can share the following content from your survey results summary to your dashboard in the form of dashboard tiles:
- Charts with associated settings
- Open Text Responses including Sentiment Analysis
To add data to a dashboard go to one of your survey results summaries and create a chart or configure your view settings. Save these changes.
Once you're happy with data, you can Pin it to a dashboard(s) or your choice or create a new one:


Once you've "Pinned" your content to your dashboard you will see a success message and option to view the content within the dashboards.
When content is shared to a dashboard, the content tile becomes detached from the results summary. This means you can make changes to your results summary without impacting the dashboard. You can make minimal changes to the content tile from within the dashboard, such as chart type (coming soon).
Adding data from within your Dashboard
Click on "Add a Tile" to add a tile directly to your dashboard. You can choose from Charts, Response Lists and Text. 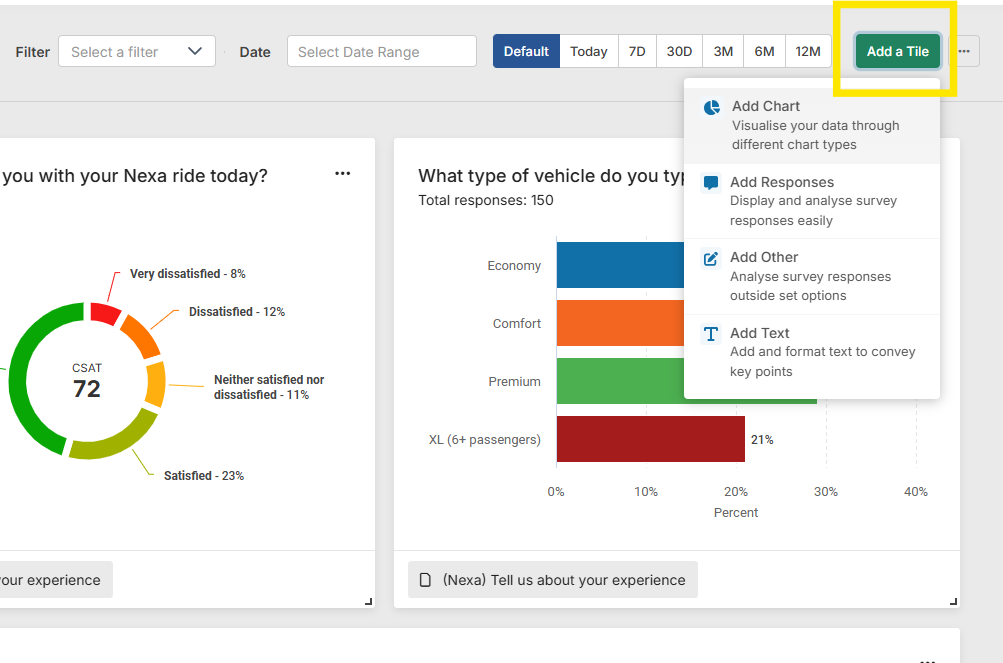
Selecting Questions or Response Counts
Available soon will be the ability to report on response counts for the whole of your survey. Add Chart, Select Response Counts then continue to select the chart.
You can then choose to report on number of responses for each Collector (Tracking link).
Configuring your dashboard
Once you've added content to your dashboard you can then begin to configure the dashboard. The options you can configure within the dashboard are:
- Tile position & sizing
- Show & hide tile tags - tags show the survey, filter and date range information for the tile data
- Add Text & Imagery - Add a tile that includes text with formatting
- Duplicate Tiles
- Edit chart tiles
- Adjust overall data range across the dashboard tiles
- Adjust overall filter across all dashboard tiles (New)
Changes made are automatically saved by any user making configuration changes. Date ranges are an exception and are not saved, so every time the dashboard is visited, the default date range is used for all tiles.


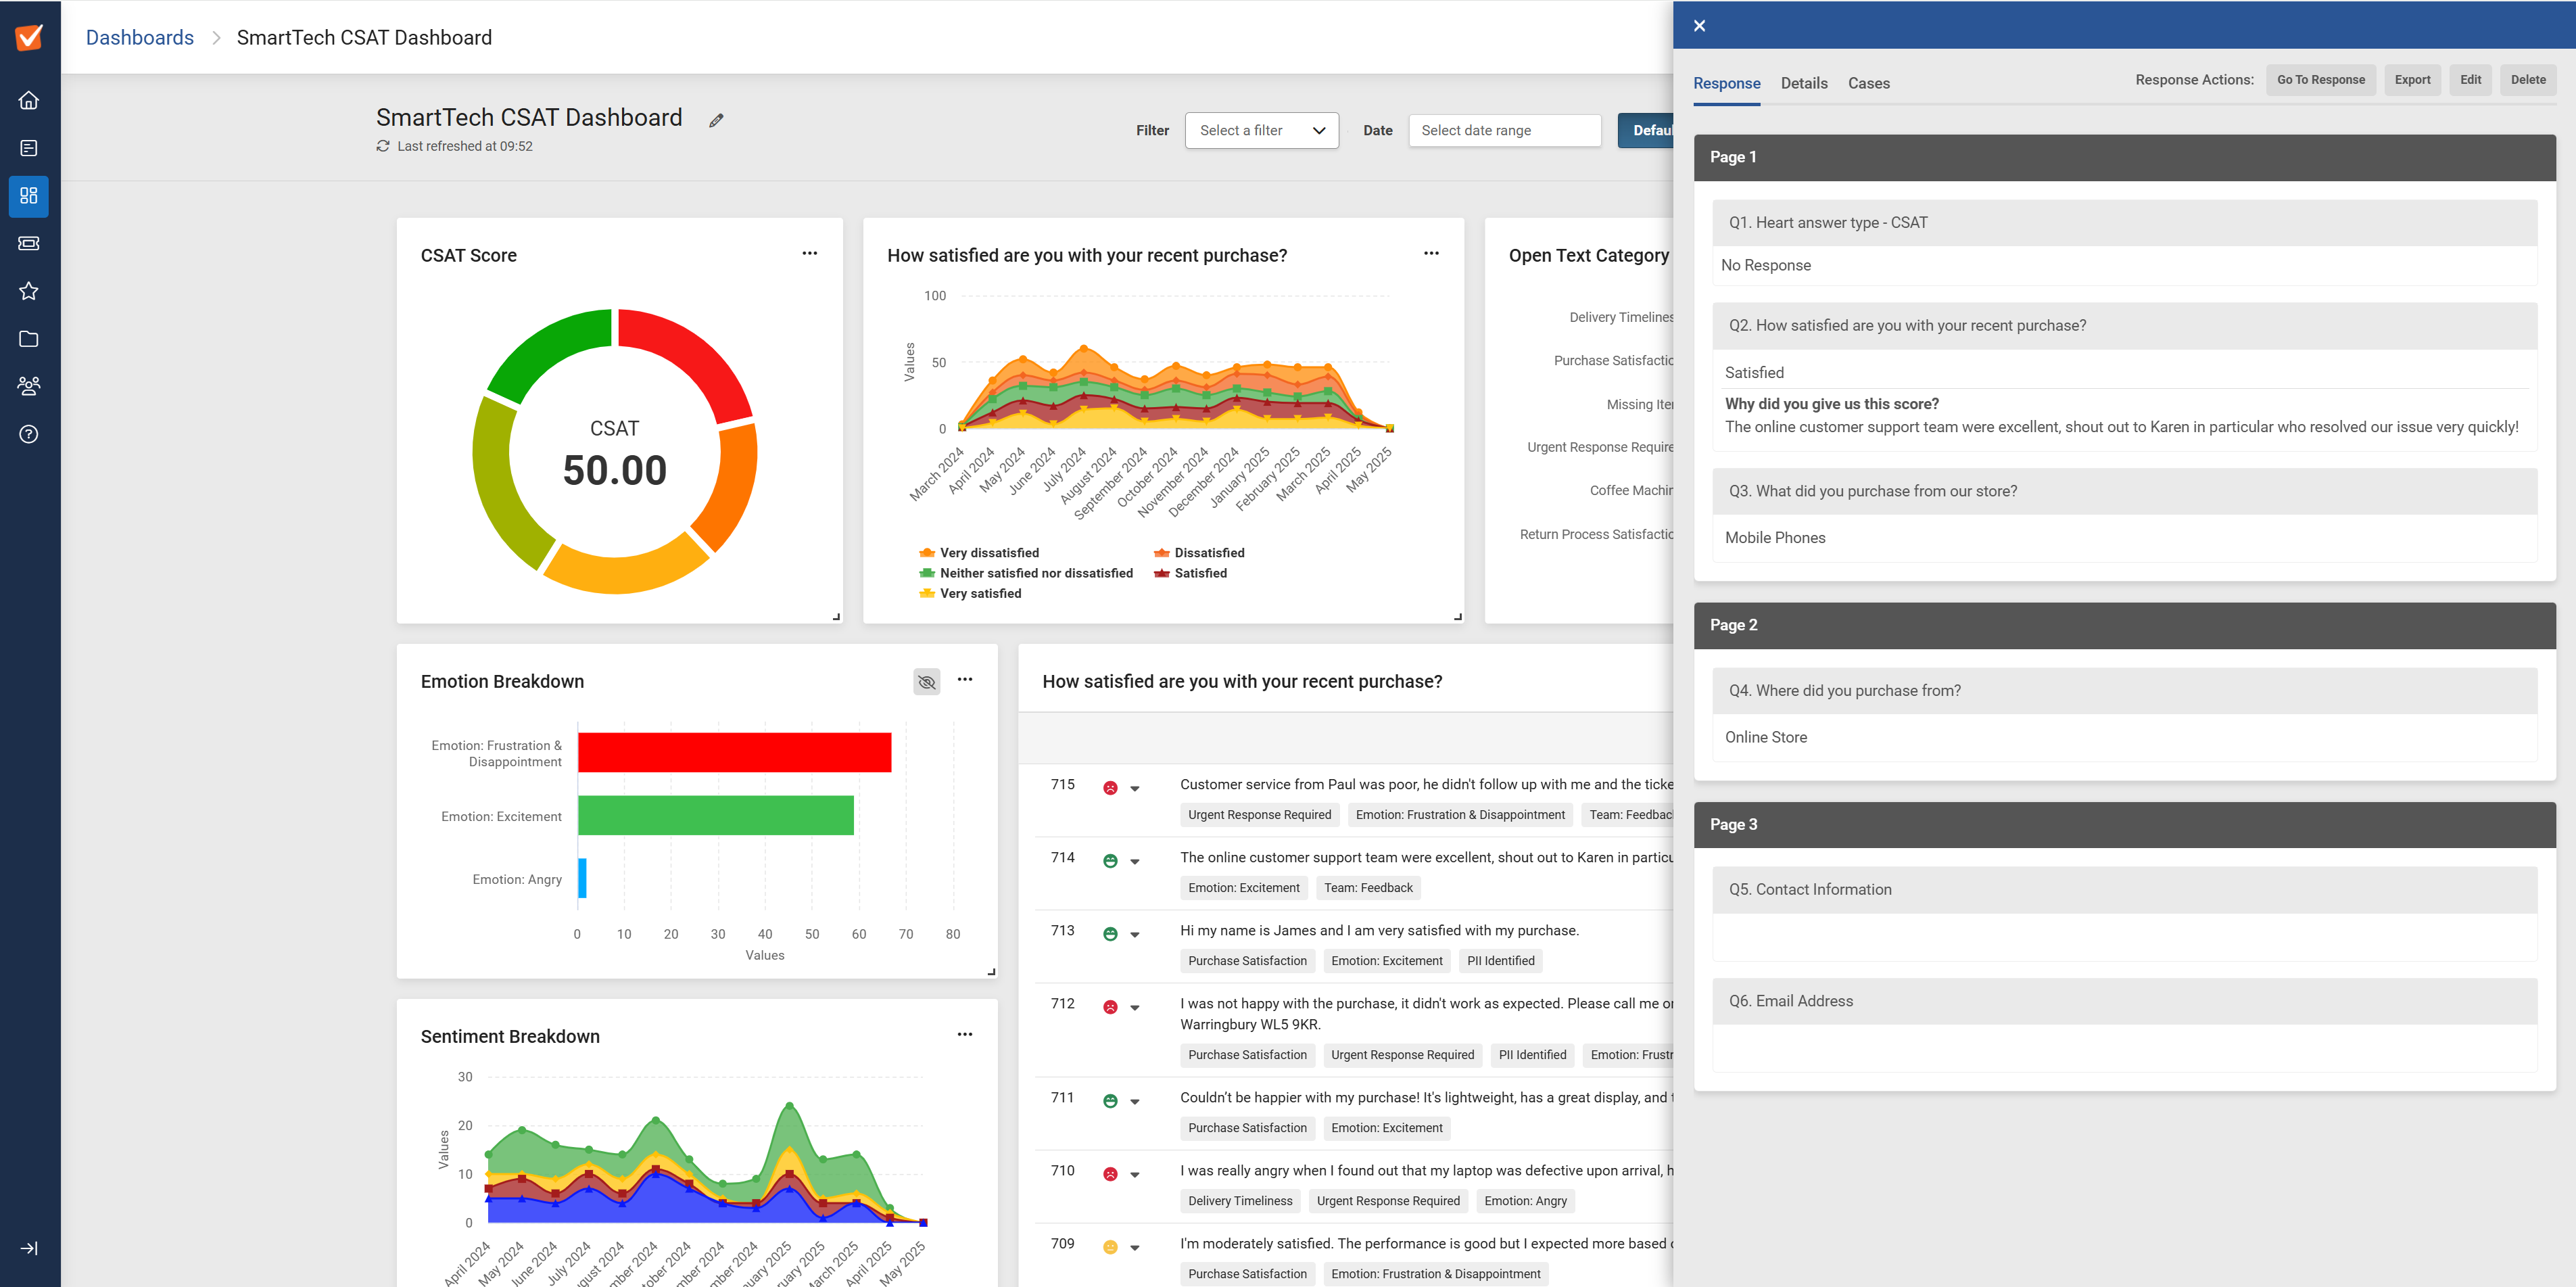
Viewing Responses
From your "Responses" dashboard tiles, you can click into the specific response which will open the response sidebar, allowing you to view the full response. Depending on survey permissions, you'll also be able to edit/delete the response as well as create Cases for follow up.
Dashboard Permissions
You can provide access to dashboards to other users within your account by updating the Dashboard permissions.
When you provide a user with access to your dashboard they can do the following:
- View & Edit the dashboard with the same settings as the dashboard owner
- Pin data from their surveys to the dashboard - this results in users with access to the dashboard potentially viewing data from surveys they do not have access to.

Sharing Dashboards
You can share your dashboards outside of SmartSurvey using a public link. You can do this by clicking on the Three dots "..." button in the top right of the dashboard page and clicking Share:

You'll then see some options to configure your shared dashboard:
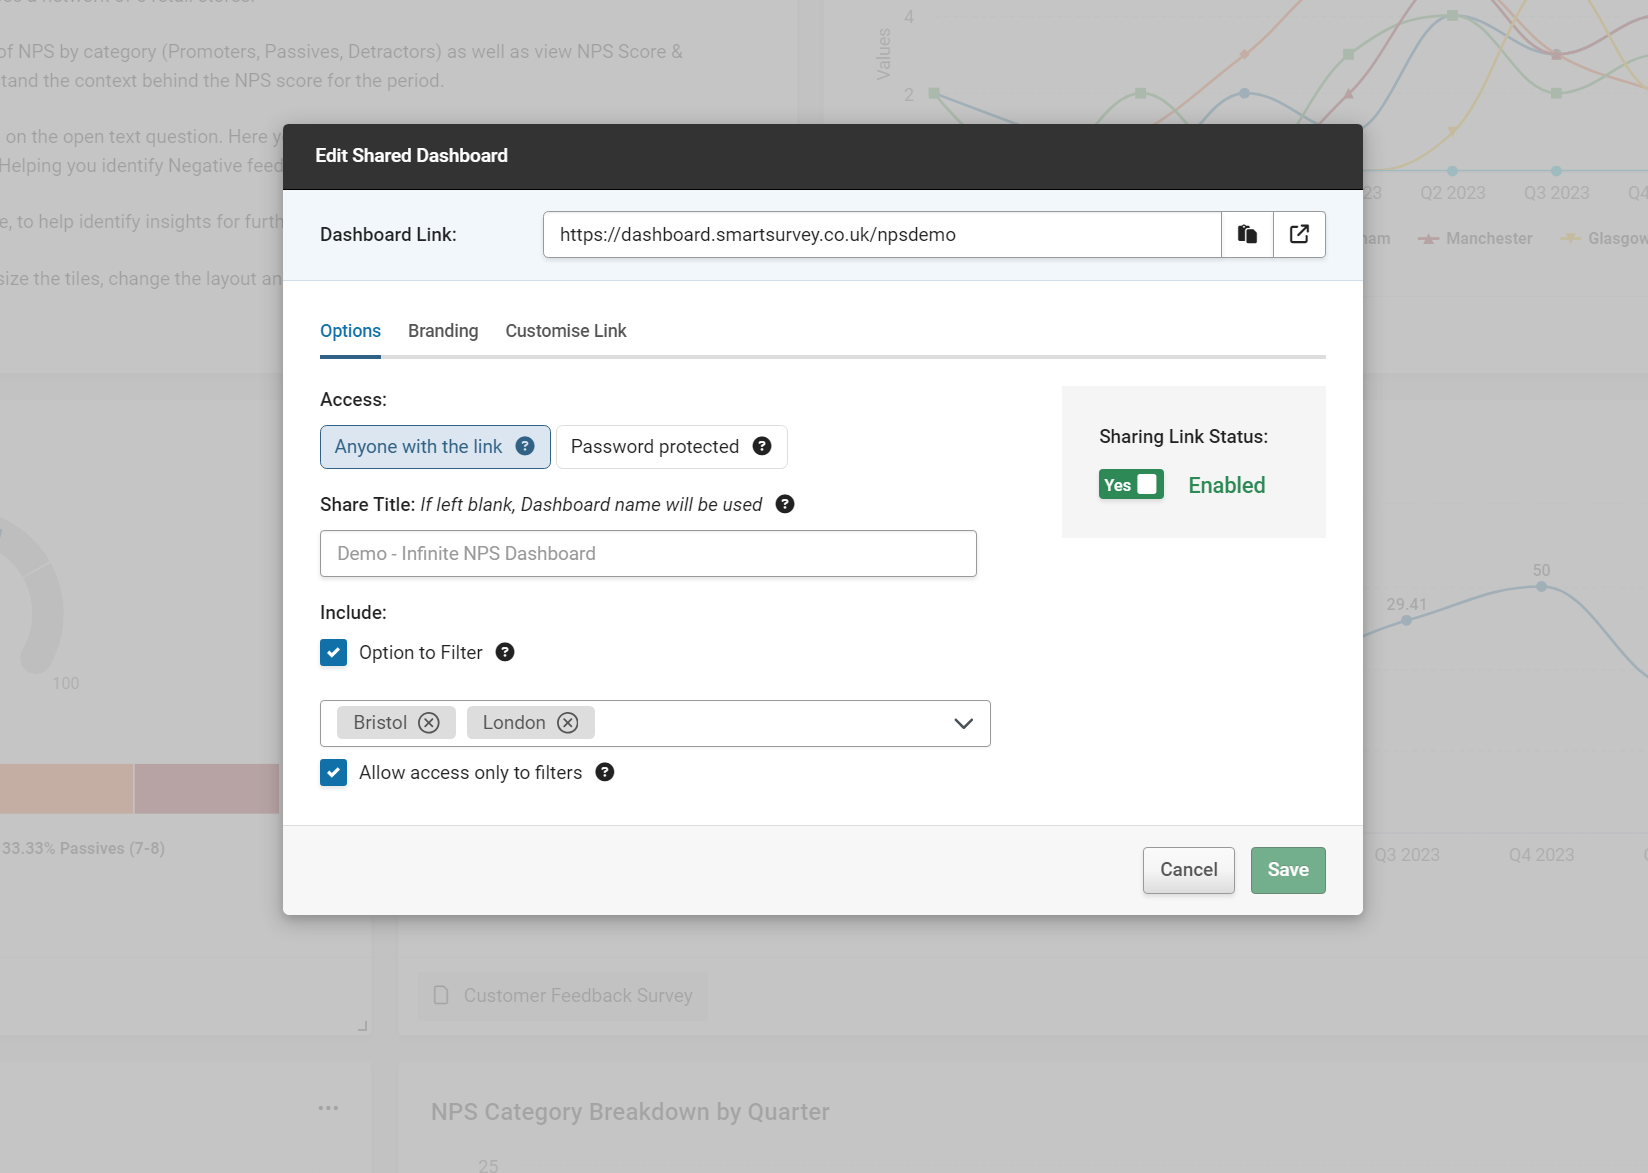
From here you have the following options:
- Change the title on your shared dashboard
- Add a password that users will need to enter to gain access to your dashboard
- Enable your dashboard link - you can enable and disabled depending on who and when you want your dashboard visible
- Enable filters to be used the dashboard user
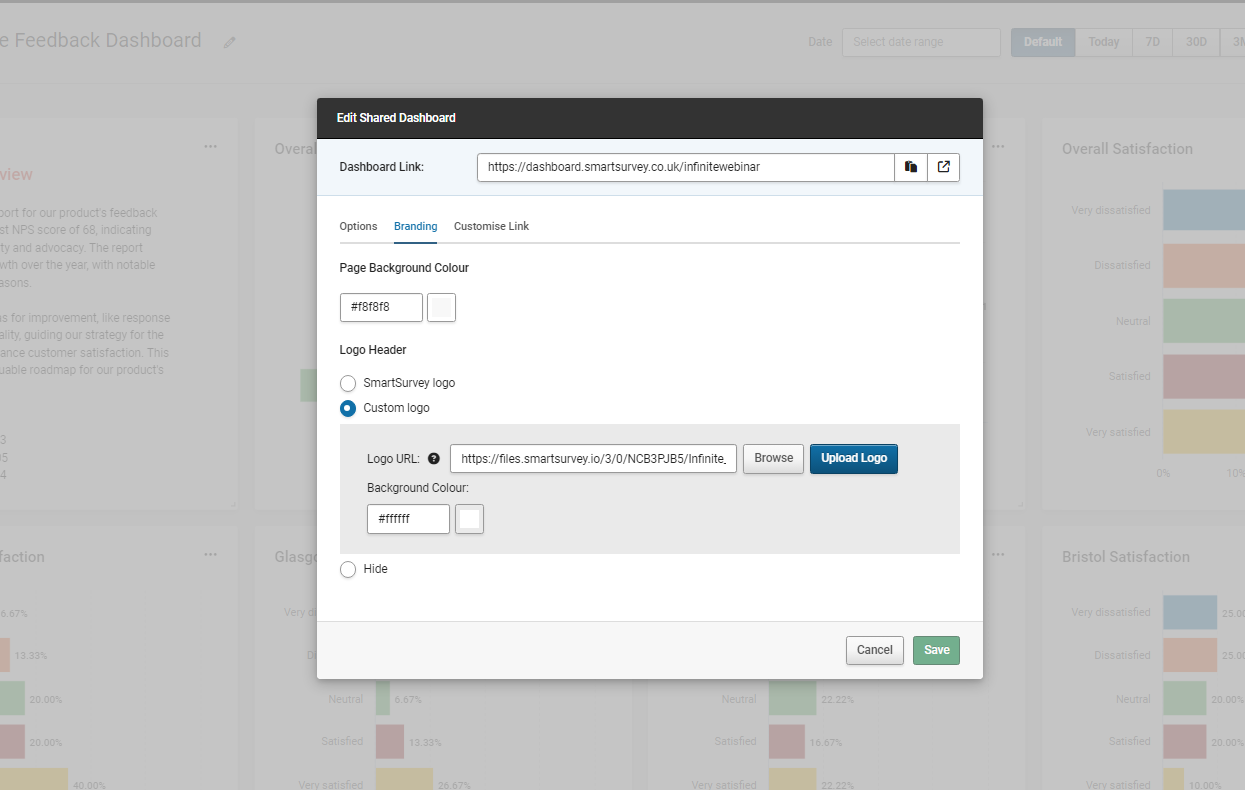
- Change the page background colour
- Upload your logo and change the header colour
- Change your link text
- Choose to you use your own custom domain if you have one configured
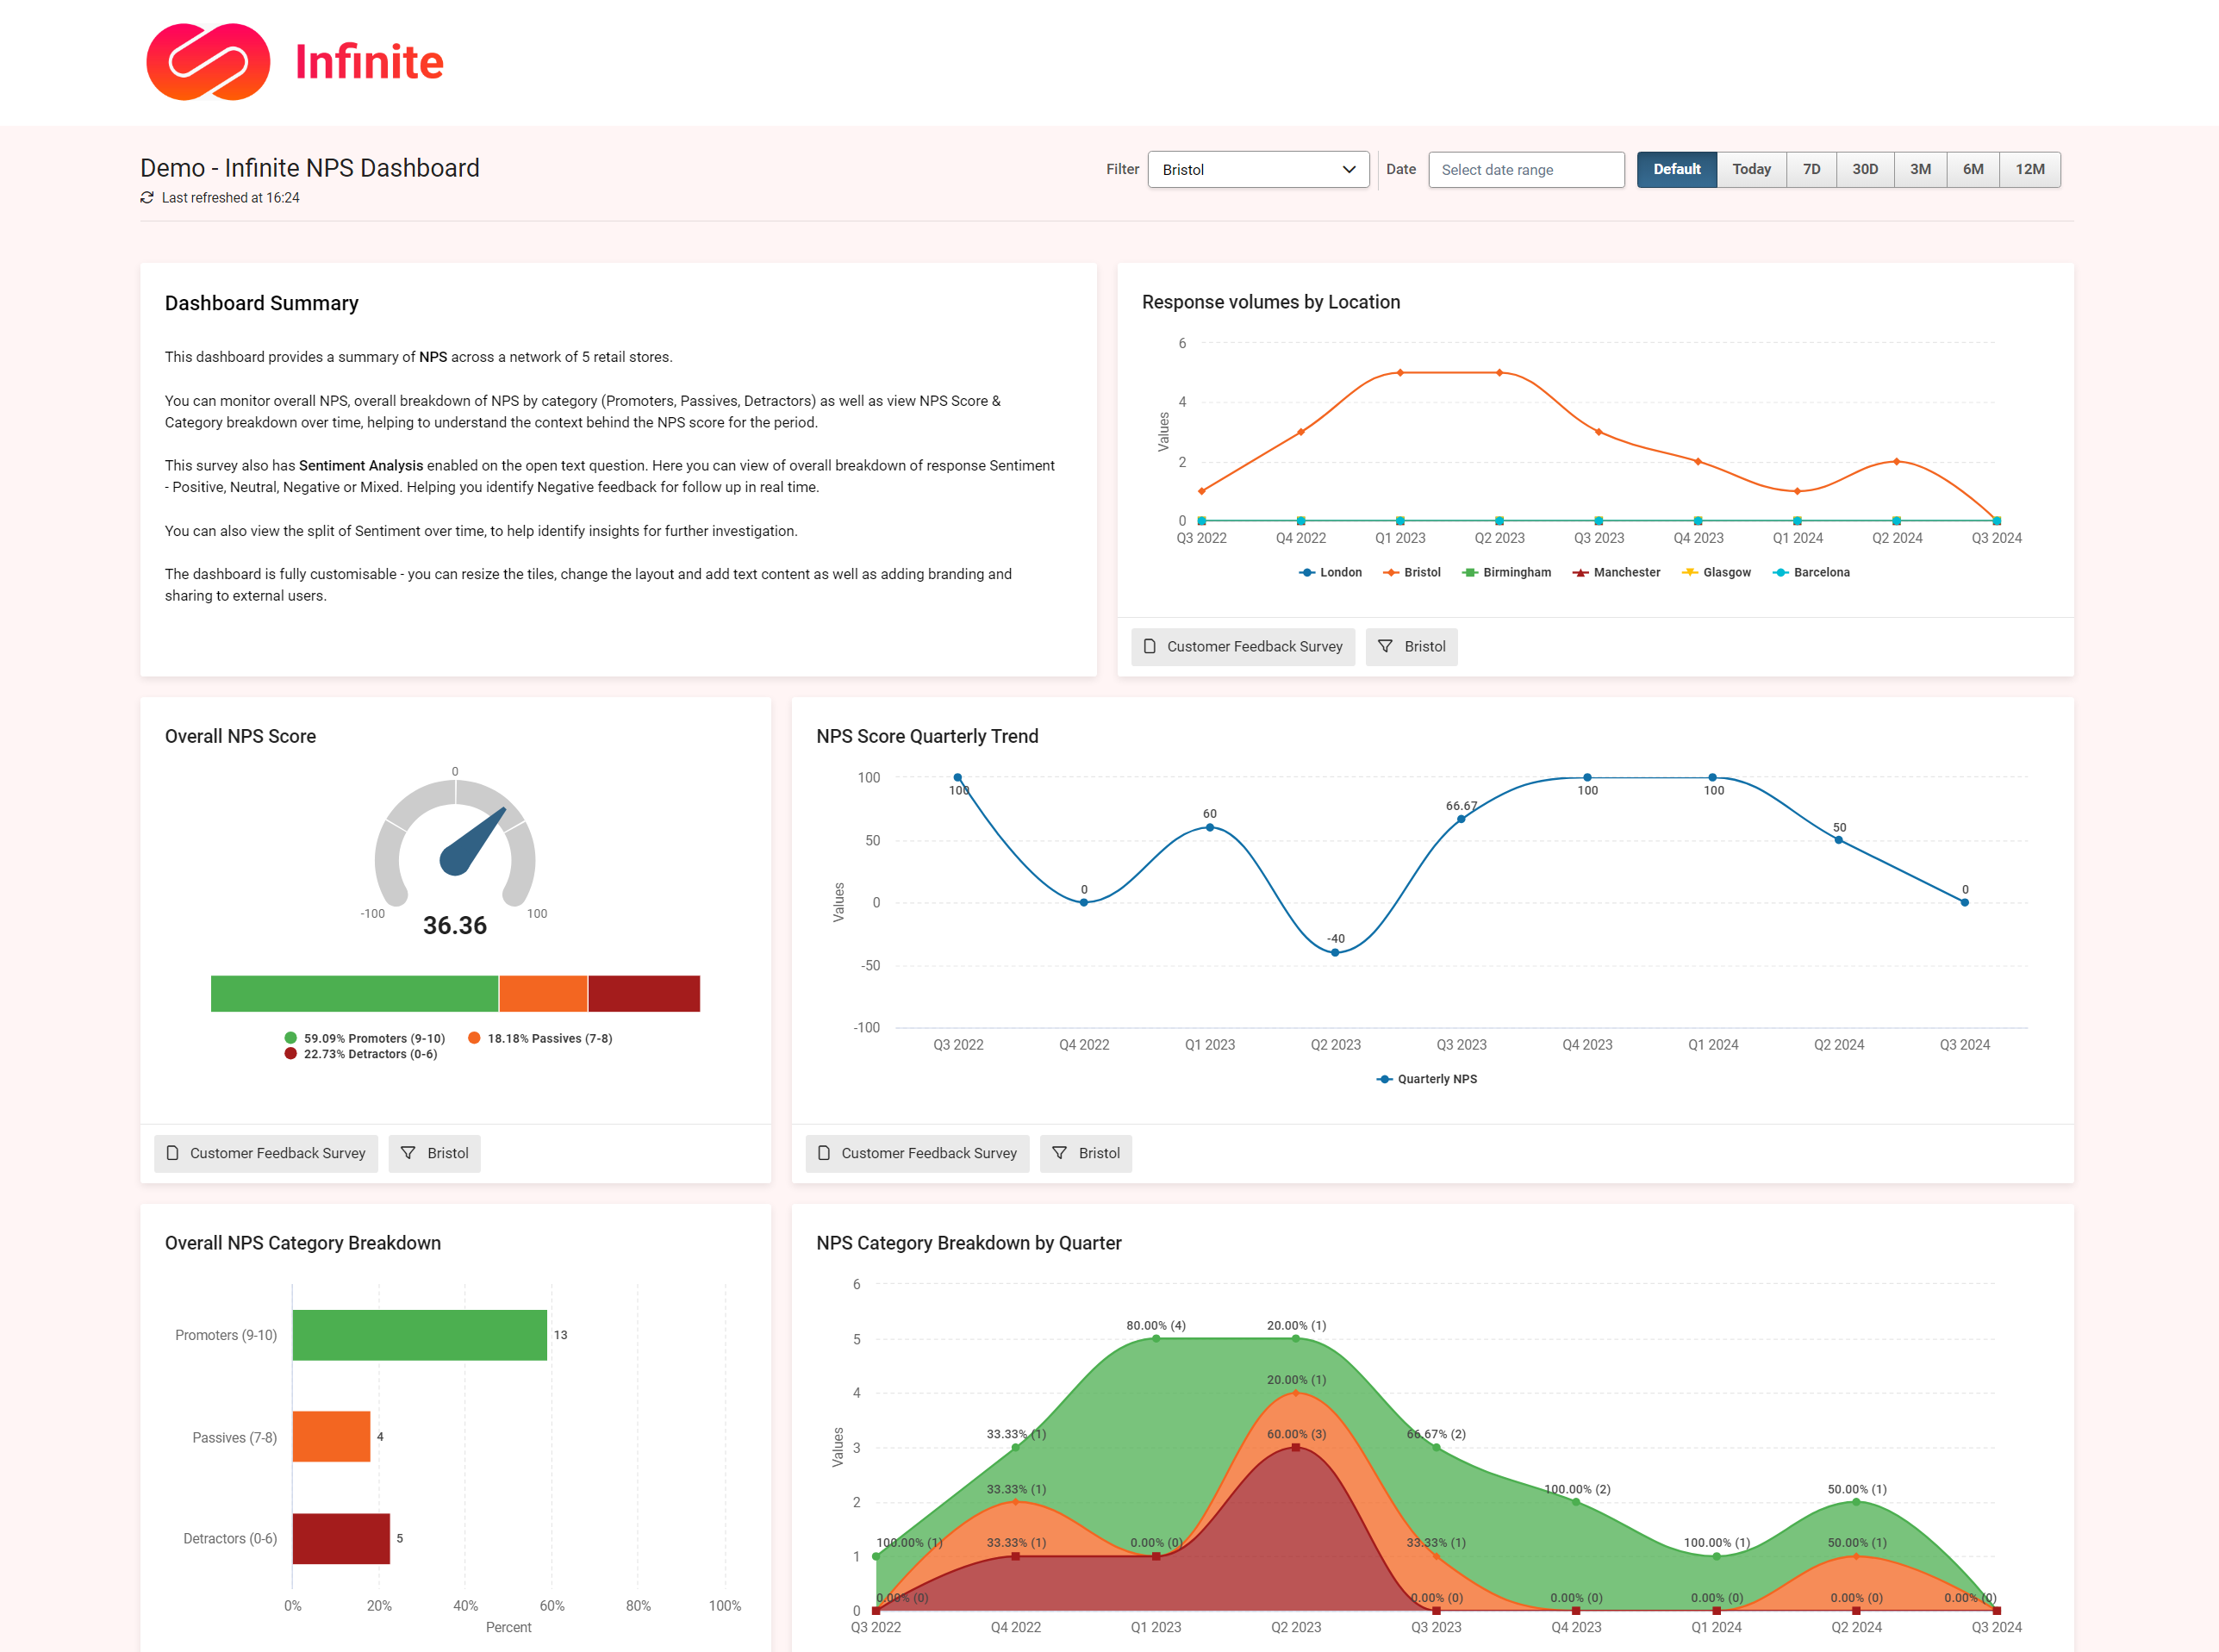
Refreshing data
Data is refreshed every 5 minutes within your dashboard. You can see the "last refreshed" time in the top left of the dashboard.